Overview
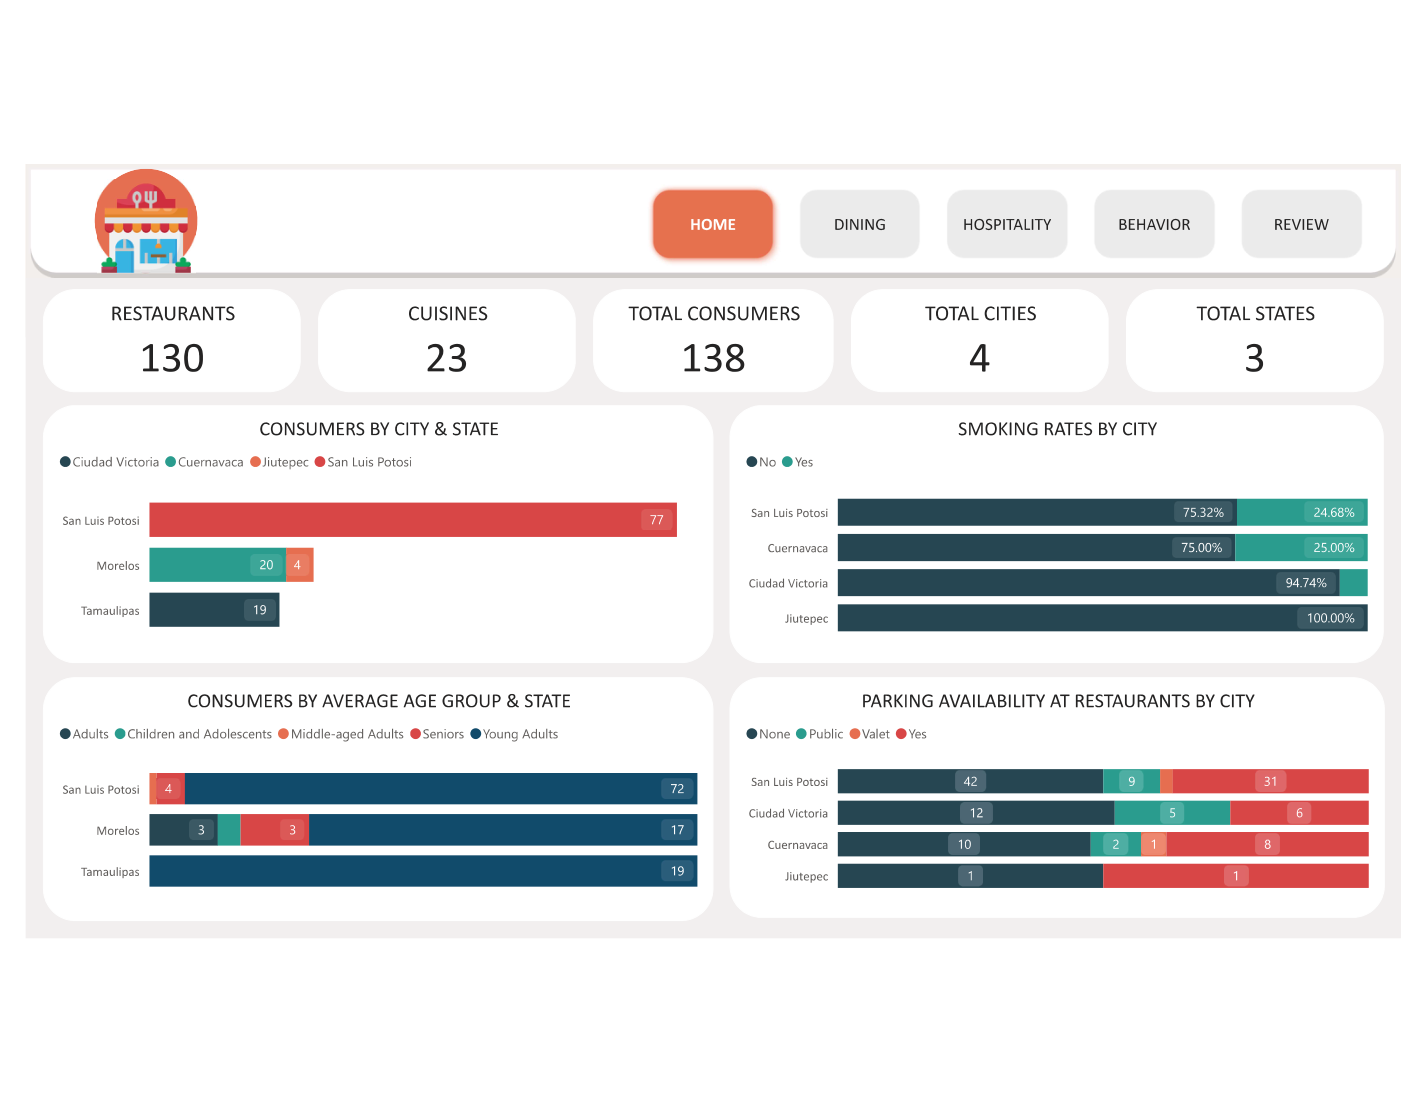
This dashboard analyses a publicly available dataset from Mexico covering restaurant ratings, consumer profiles, and dining preference data. The dataset spans 130 restaurants across three Mexican states (San Luis Potosí, Tamaulipas, and Morelos) and 138 consumer profiles with detailed demographic and preference attributes — making it ideal for demonstrating multi-entity relational data modelling in Power BI.
The report was designed to answer both supply-side questions (what attributes make a restaurant highly rated?) and demand-side questions (what do different consumer segments prefer?). The 5-page layout uses Power BI bookmarks for panel-based navigation, giving the report a polished web-app feel rather than a static multi-tab report.
Data Sources & ETL
- 📥 Source files: 5 separate CSV files — restaurants.csv, restaurant_cuisines.csv, consumers.csv, consumer_preferences.csv, and ratings.csv — each representing a separate entity in the data model
- 🔄 Data model design: Relational star-adjacent model with Ratings as the central fact table; Restaurant and Consumer as dimension tables; Cuisine and Consumer Preference as bridge tables for many-to-many relationships
- 🍽️ Cuisine bridge: A restaurant can serve multiple cuisines; a consumer can prefer multiple cuisines — both resolved with bridge tables and DAX CROSSFILTER for bidirectional relationship handling
- 📅 No date dimension needed: Dataset is cross-sectional (no time series); analysis focuses on attribute-based segmentation rather than time intelligence
- 🔗 Rating normalisation: Ratings on a 0–2 scale (0=Bad, 1=Average, 2=Good) converted to descriptive labels in Power Query; separate columns for Overall, Food, and Service ratings
- ✅ Consumer attribute cleaning: Budget level, marital status, occupation, and transport mode fields standardised from inconsistent text casing and abbreviations in the source data
Key Visuals & Features
- 🏠 Page 1 — Overview: Total restaurants (130), total consumers (138), total ratings logged, and average overall rating KPI cards; geographic bubble map of Mexico showing restaurant locations coloured by average rating; state-level rating comparison bar chart
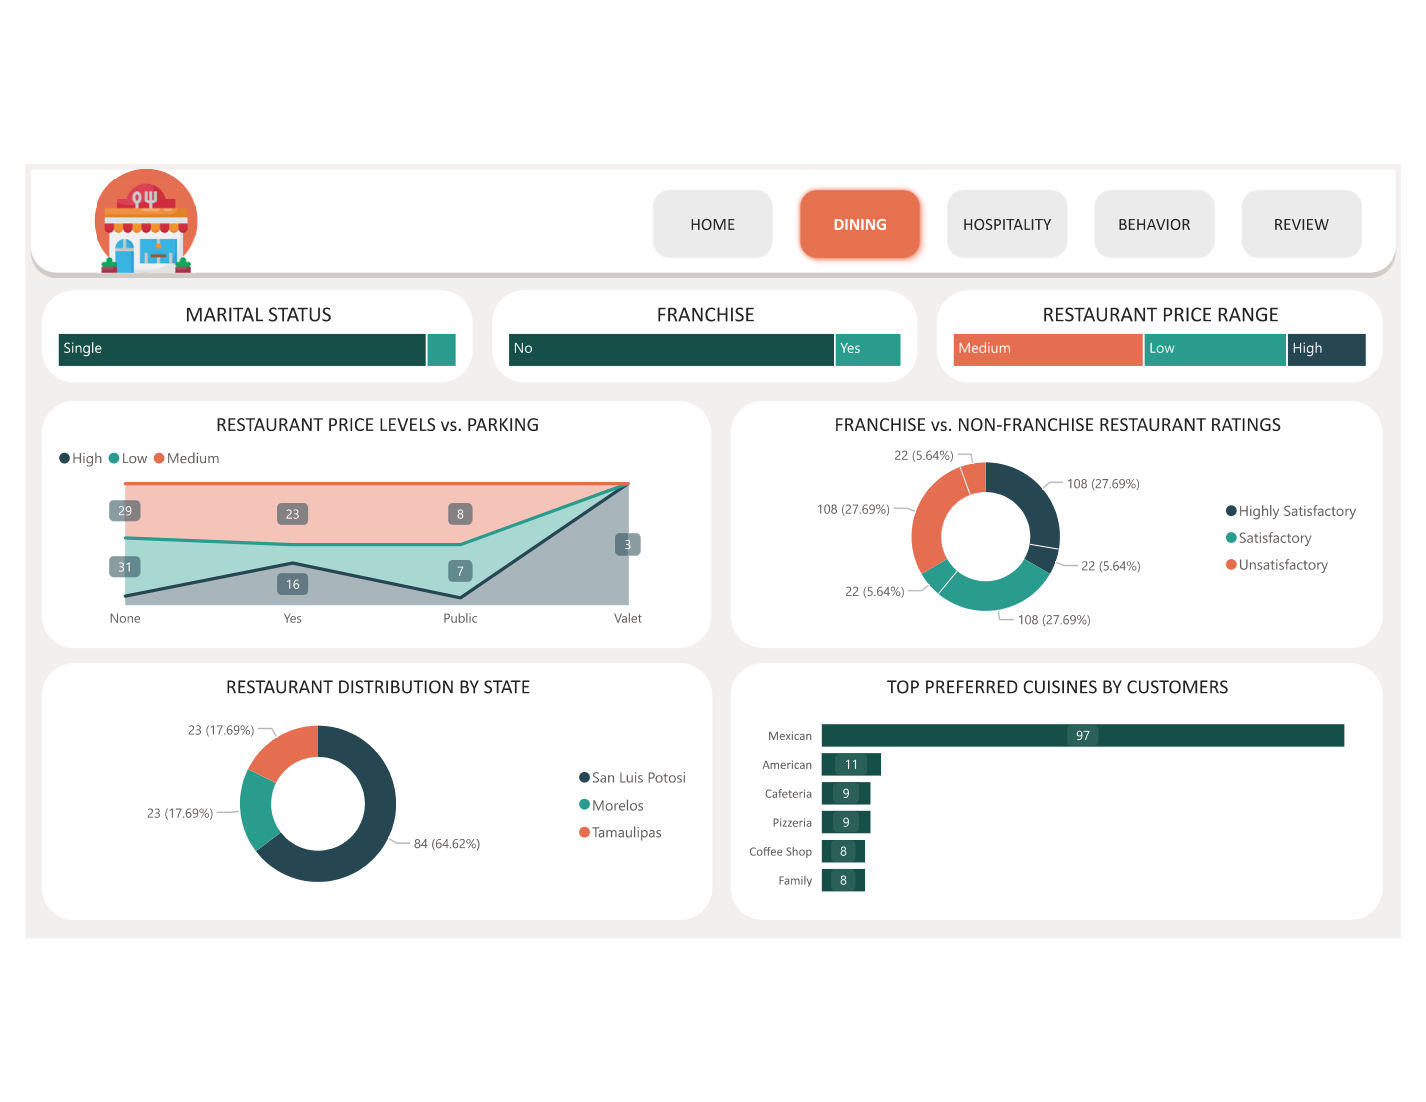
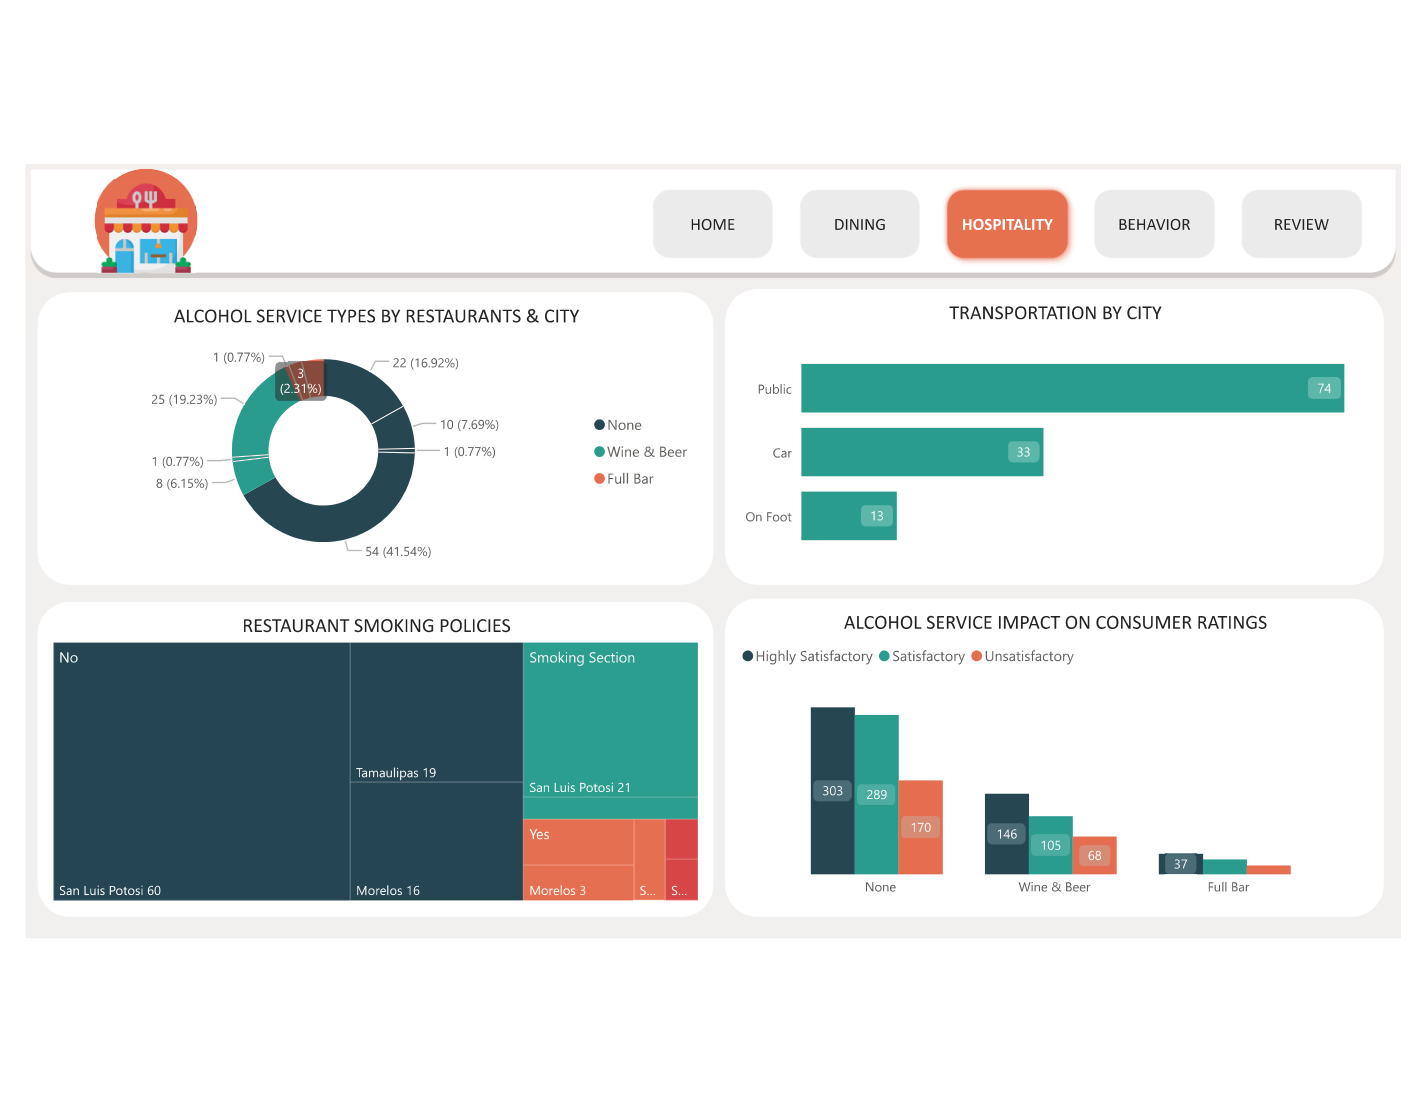
- 🍴 Page 2 — Restaurant Analysis: Top-rated restaurants ranked by average overall score; rating breakdown by cuisine type (Mexican, Fast Food, Café, International, etc.); restaurant attribute analysis (parking, alcohol, smoking, price range) vs rating scatter
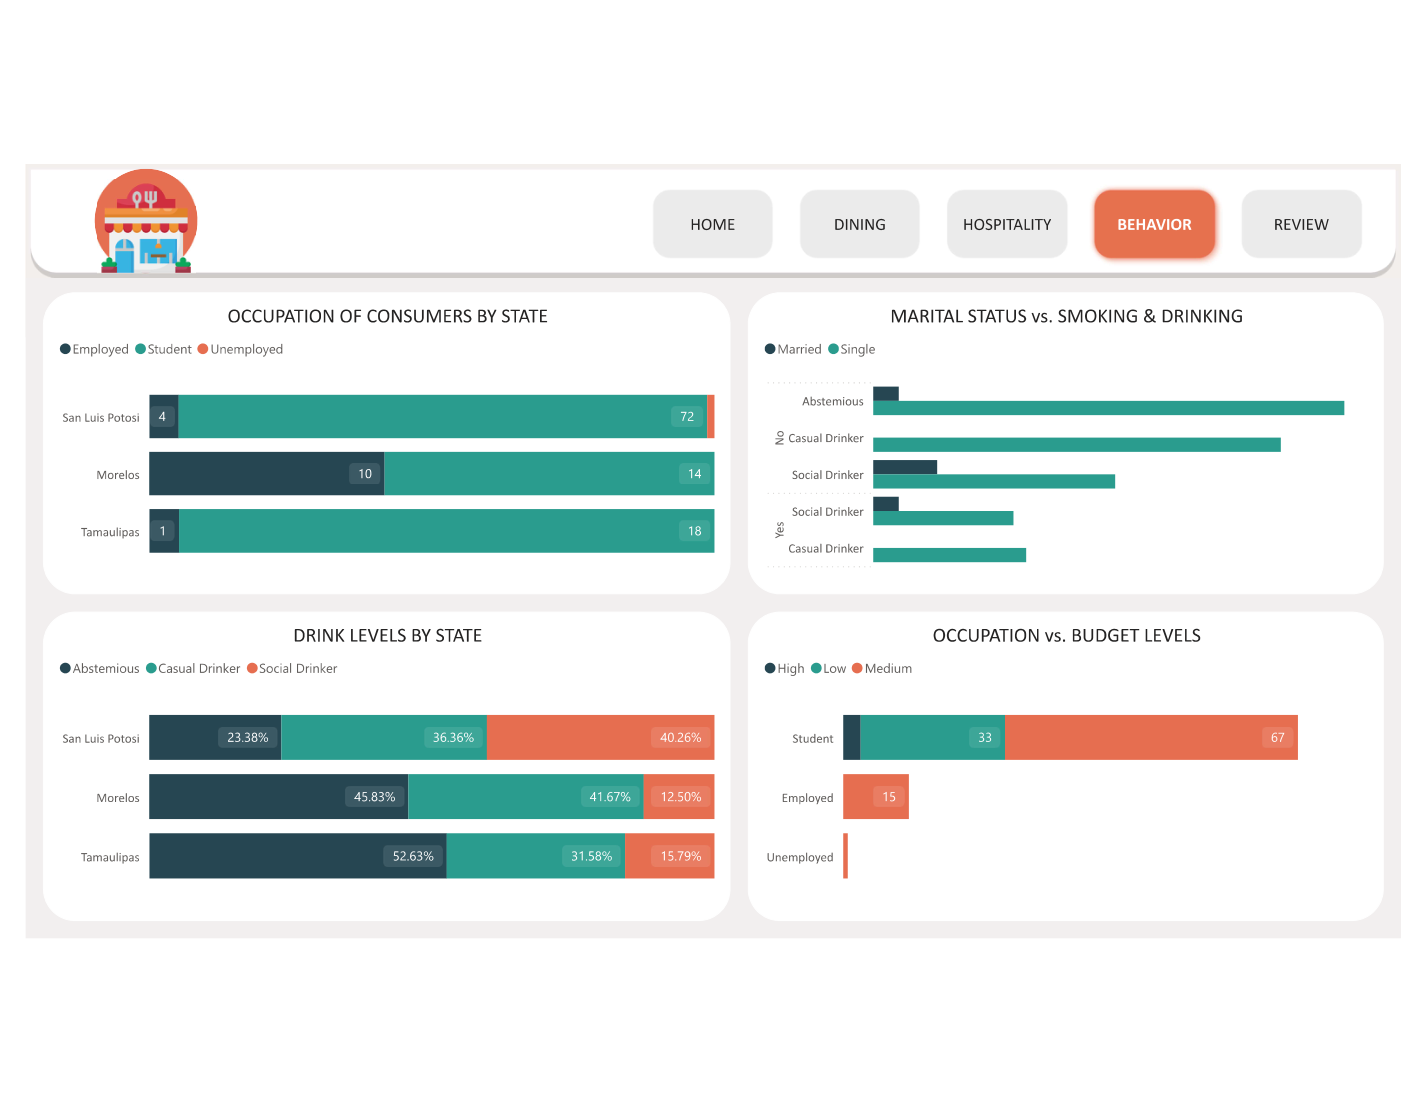
- 👥 Page 3 — Consumer Demographics: Consumer age distribution histogram; budget level donut (Low / Medium / High); occupation breakdown; transport mode split; marital status and education level bar charts — all cross-filterable
- ❤️ Page 4 — Preference Matching: Consumer cuisine preference vs actual restaurant cuisine visited match rate; preference satisfaction score — are consumers eating what they prefer?; demographic breakdown of preference by age group and budget level
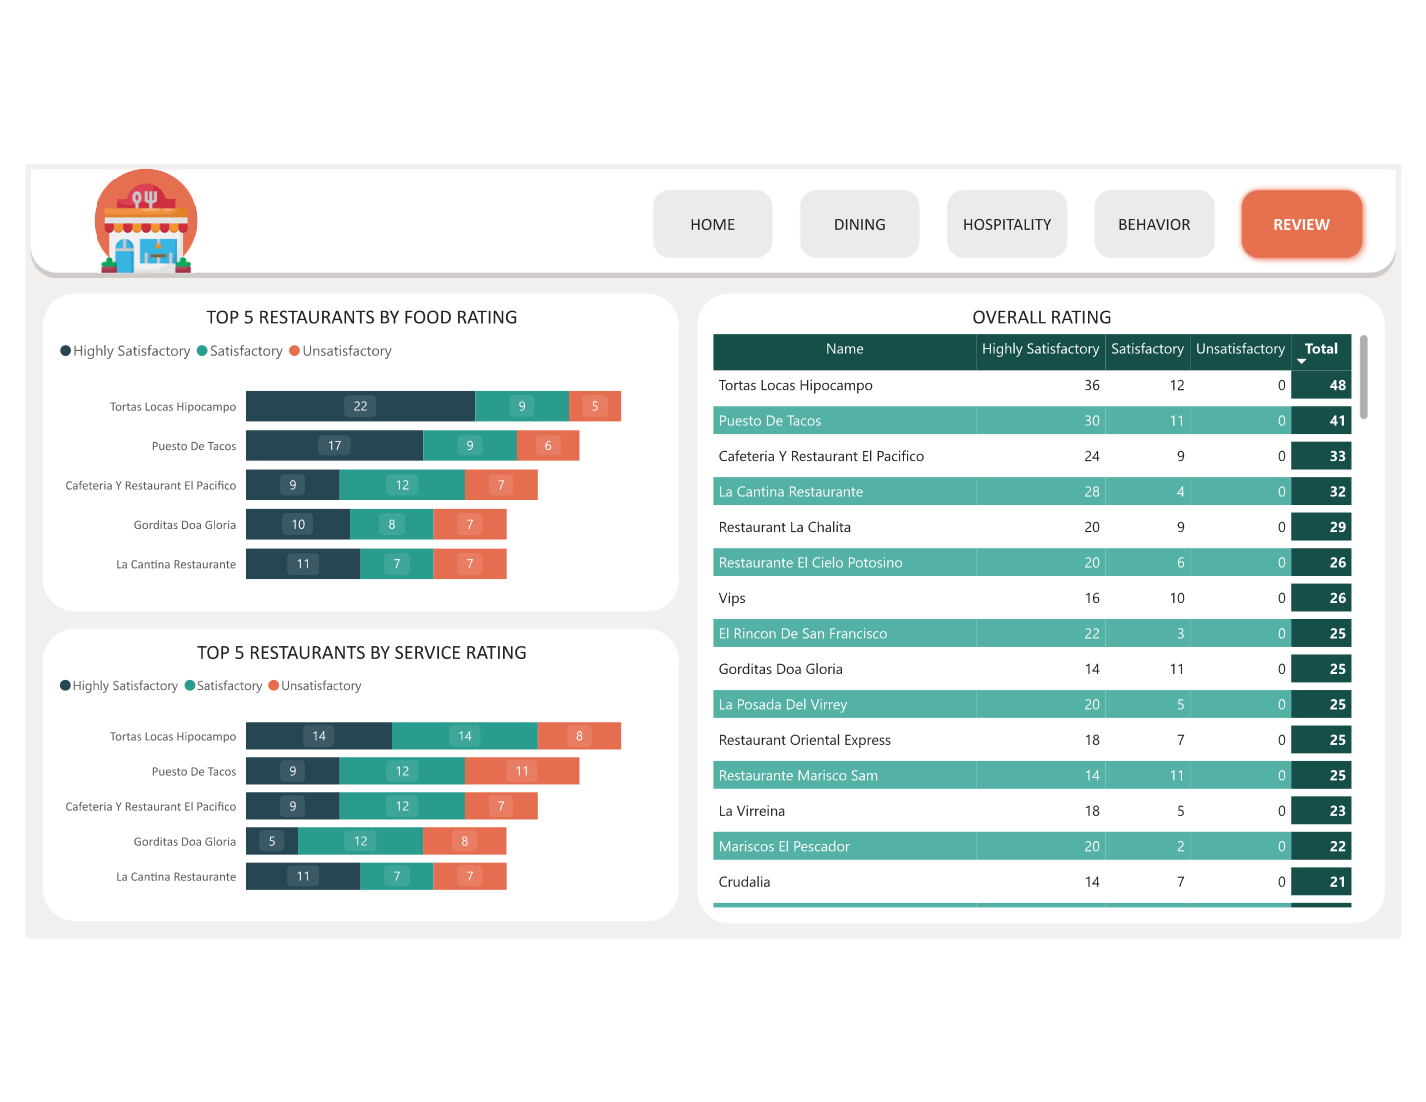
- ⭐ Page 5 — Rating Deep-Dive: Overall vs Food vs Service rating comparison matrix per restaurant; rating consistency score (variance in ratings from different consumers); top-rated and lowest-rated restaurants with attribute fingerprint cards
- 🔖 Bookmark navigation: Custom navigation panel built with bookmarks and buttons — each page is accessible from a persistent left-side nav panel that slides in/out, replicating a web-app navigation experience
DAX Highlights
- → Average Overall Rating = AVERAGE(Ratings[Overall_Rating]) — used across all pages with context filters applied automatically via relationships
- → Cuisine Match Rate = DIVIDE(CALCULATE(COUNTROWS(Ratings), TREATAS(...)), COUNTROWS(Ratings)) — measures how often consumers visit restaurants matching their stated cuisine preference
- → Rating Consistency = STDEVX.P table function calculating variance in ratings per restaurant — used to identify polarising vs consistently-rated venues
- → Top N Restaurants = RANKX(ALL(Restaurant[Name]), [Avg Overall Rating],, DESC, Dense) for dynamic top-N filtering
Results & Impact
130Restaurants analysed across 3 Mexican states
5 pagesWith bookmark-based web-app navigation
3 rating dimsOverall, Food, and Service scores tracked