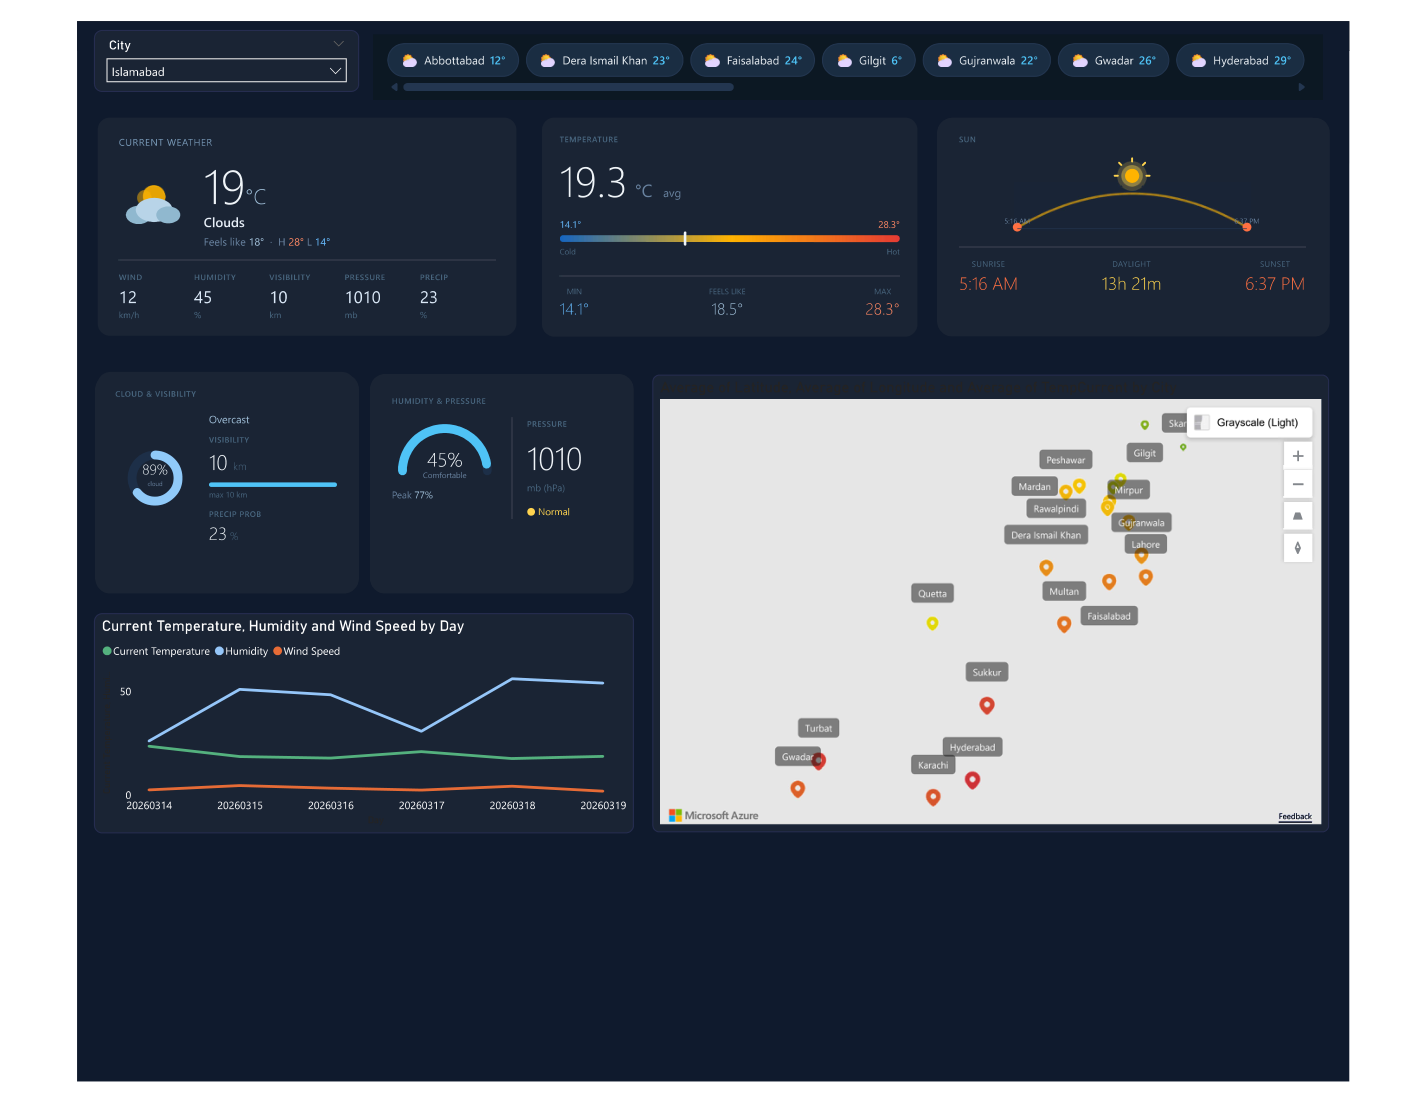
Overview
This project demonstrates end-to-end integration between a live REST API and Power BI — one of the most commonly requested capabilities in modern BI work. The OpenWeatherMap API provides real-time and forecast weather data for any city worldwide. The challenge was to build a fully automated pipeline that pulls this data on a schedule, stores it in a structured format, and feeds a Power BI dashboard that always reflects the latest conditions.
The dashboard covers major Pakistani cities (Karachi, Lahore, Islamabad, Peshawar, Quetta) and displays current conditions alongside a 7-day forecast trend. The dark-theme design was deliberately chosen to mirror the aesthetic of professional weather and IoT monitoring platforms, reinforcing the technical nature of the data source.
Data Pipeline & ETL
- 🌐 API source: OpenWeatherMap One Call API 3.0 — called with city coordinates to retrieve current conditions (temperature, humidity, wind speed, pressure, weather description, UV index) and 7-day hourly forecast data
- 🐍 Python extraction script: Python script using the
requestslibrary makes scheduled API calls for each target city; parses the JSON response; flattens nested forecast arrays into a tabular structure; appends to a local SQLite database with a timestamp for historical trend tracking - 📦 Data storage: Two SQLite tables —
weather_current(one row per city per refresh) andweather_forecast(7 rows per city per refresh for the 7-day outlook); indexed on city + timestamp for fast query performance - ⏱️ Scheduling: Python script scheduled via Windows Task Scheduler to run every 3 hours; each run appends a new snapshot, building a historical dataset over time
- 🔌 Power BI connection: Power BI Desktop connects to the SQLite database via ODBC; data refresh in Power BI Service runs on a matching 3-hour schedule to keep the dashboard current
- 🔄 Power Query transformations: Timestamp column converted to local Pakistan Standard Time (UTC+5); temperature values in Kelvin converted to Celsius; wind speed converted from m/s to km/h; weather condition icons mapped from code to emoji labels
Key Visuals & Features
- 🌡️ Current conditions strip: A card row showing current temperature, feels-like temperature, humidity, wind speed, UV index, and weather description for the selected city — updated on every refresh
- 📅 7-day forecast: Horizontal card layout showing min/max temperature and weather icon for each of the next 7 days — the centrepiece of the dashboard's visual hierarchy
- 📈 Temperature trend: Line chart plotting hourly temperature over the 7-day forecast window, with a reference band showing the historical average for the same period
- 💧 Humidity & precipitation: Area chart showing humidity percentage trend; precipitation probability bar chart for the forecast period
- 🏙️ City comparison: Matrix visual comparing all 5 cities side-by-side on current temperature, humidity, and wind speed — useful for regional weather contrast
- 🎨 Dynamic background: Dashboard background colour shifts subtly between a cool blue-grey palette (for cold/cloudy conditions) and a warm amber palette (for hot/clear conditions) based on a DAX condition measure — a purely aesthetic touch that reinforces the data story
Technical Highlights
- → API pagination handling: OpenWeatherMap returns nested JSON arrays for hourly forecasts; Python script uses list comprehension to unpack all 168 hourly records per call (24 hrs × 7 days)
- → Incremental load: Python script checks the latest timestamp in SQLite before inserting — prevents duplicate records if the scheduler runs twice in the same window
- → Error handling: HTTP status code validation; API rate limit detection with exponential backoff retry; failed city calls logged to a separate error table without stopping the pipeline
- → DAX weather condition = IF(SELECTEDVALUE(Current[Temp_C]) > 30, "Hot", IF(SELECTEDVALUE(Current[Temp_C]) < 15, "Cold", "Mild")) — drives the dynamic background conditional formatting