Overview
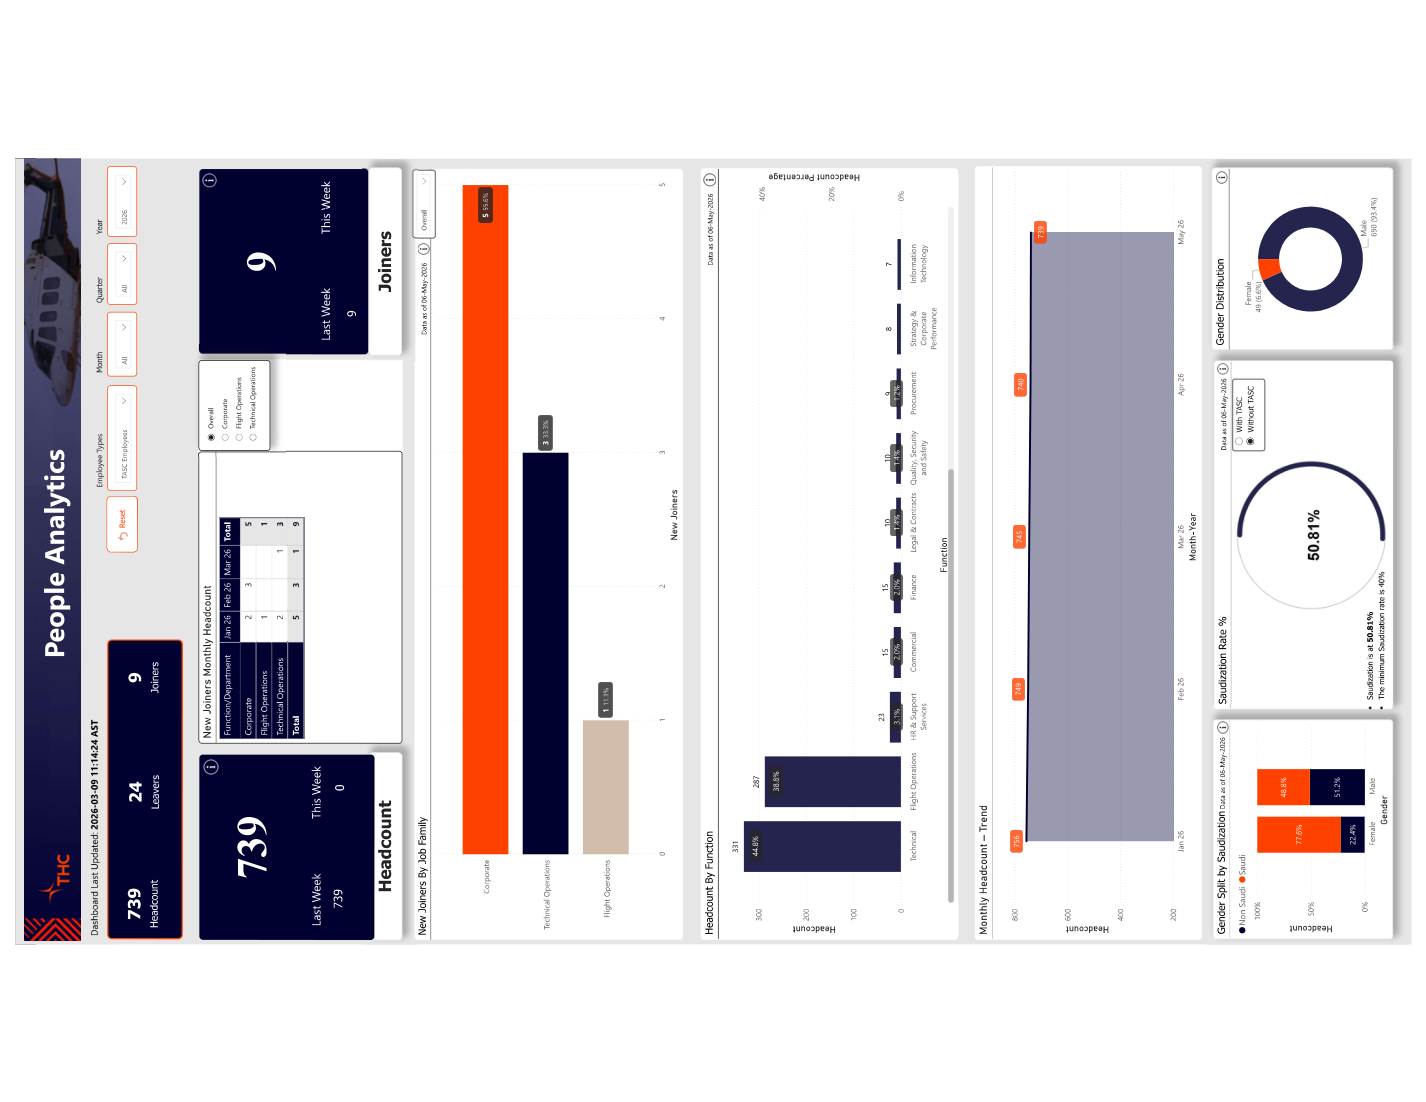
THC's HR team was managing a workforce of 739 employees across multiple departments and job grades with no consolidated view of people metrics. Monthly HR reports were compiled manually from HRIS exports, meaning headcount figures were always a month behind and Saudization compliance tracking — a regulatory requirement for Saudi businesses — was done in a separate spreadsheet that frequently had errors.
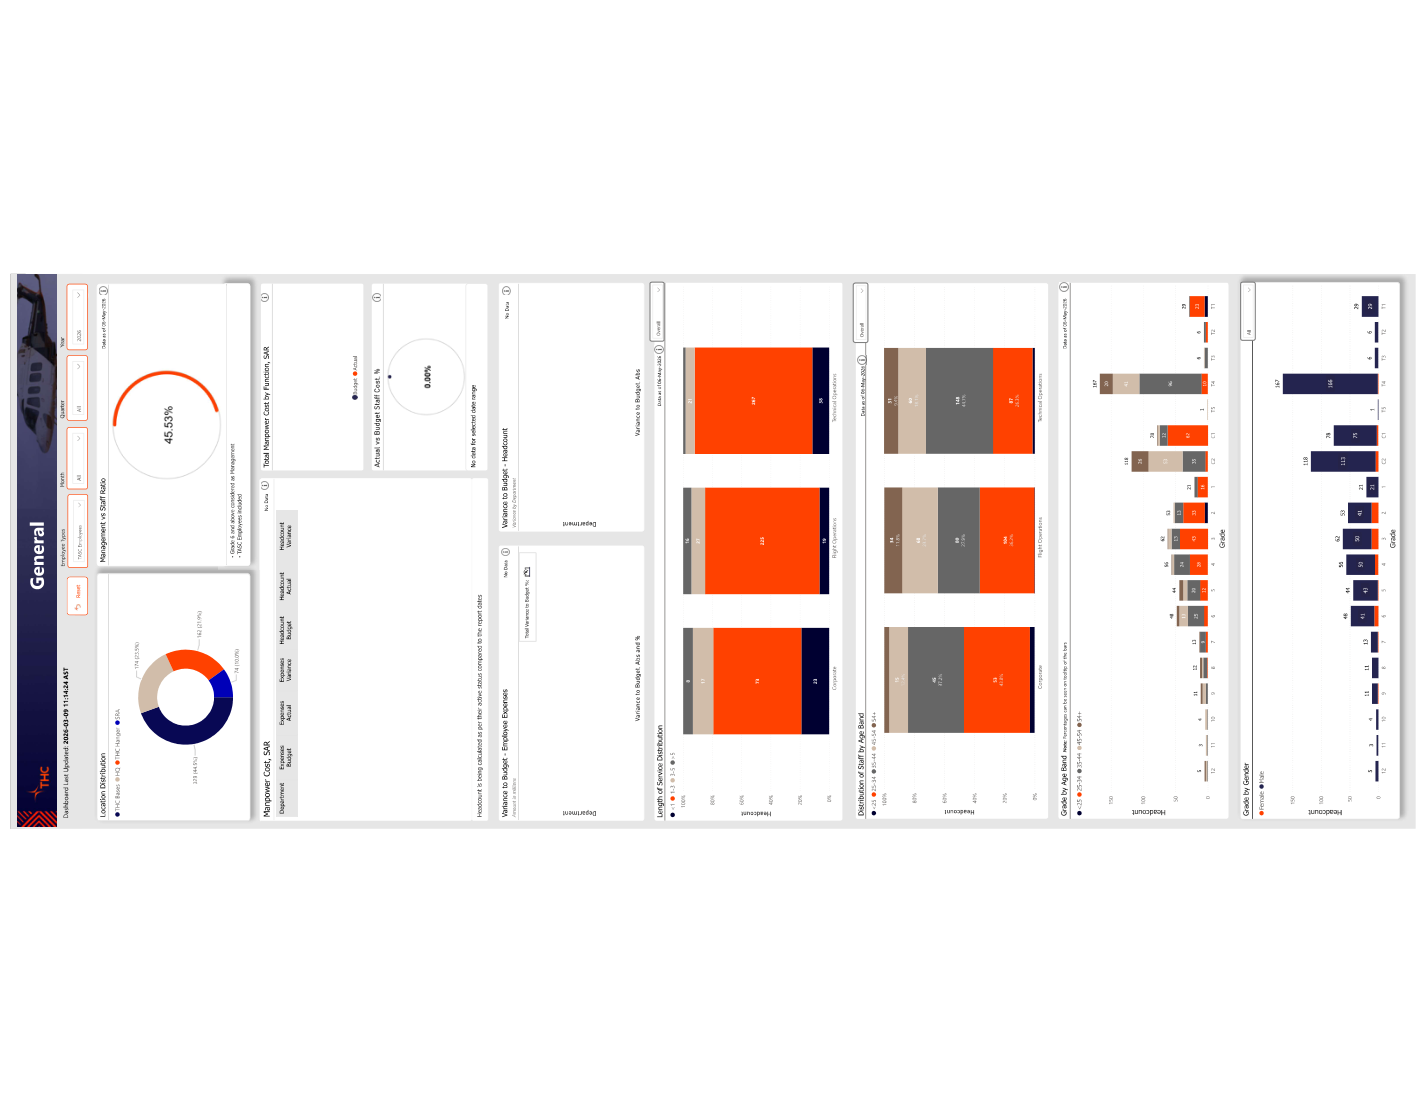
This 5-page HCM dashboard brought all workforce data into a single, always-current Power BI platform. It covers every dimension of workforce analytics that matters to HR leadership and regulators: total headcount and movement, Saudi national ratio compliance, gender representation, employee attrition patterns, and cost-per-employee metrics broken down by department and grade.
Data Sources & ETL
- 📥 Source: HRIS monthly export (CSV) containing employee records with fields: Employee ID, Name, Nationality, Gender, Department, Job Grade, Hire Date, Termination Date, Salary Band, and Status
- 🔄 Headcount snapshots: Monthly point-in-time headcount calculated in DAX using hire and termination dates — no pre-aggregated headcount table required; all movement calculated from raw records
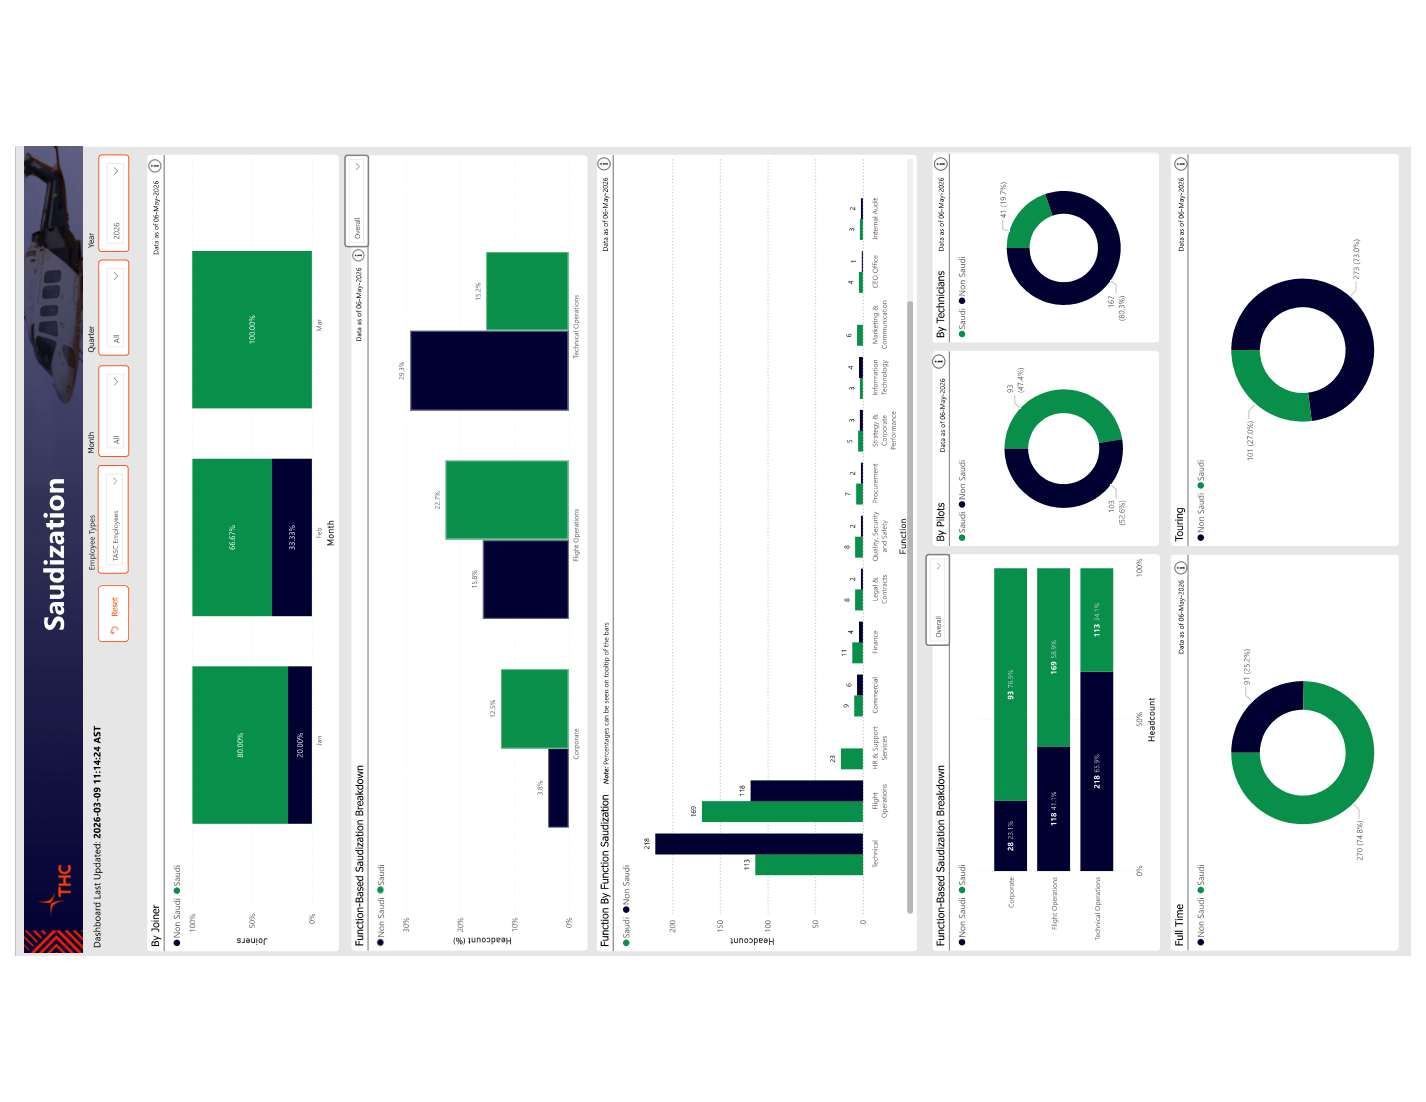
- 🇸🇦 Saudization mapping: Nationality field mapped to a Saudi / Non-Saudi binary flag; Saudization % calculated as Saudi Nationals ÷ Total Active Employees per department and company-wide
- 📅 Date table: Extended calendar table with HR-specific columns: fiscal quarter, probation end dates, tenure band groupings (0–1 yr, 1–3 yrs, 3–5 yrs, 5+ yrs)
- 🔗 Department hierarchy: Org structure loaded as a parent-child hierarchy (Division → Department → Team) with PATH() flattening for drill-through navigation
- ✅ Data privacy: Employee names excluded from all published visuals; Employee IDs used for audit trail only; report access controlled via Row-Level Security by department
Key Visuals & Features
- 👥 Page 1 — Headcount Overview: Total active employees (739), new hires MTD, terminations MTD, and net headcount change KPI cards; monthly headcount trend line; department-level headcount bar chart; employment type split (Full-Time / Contract / Part-Time)
- 🇸🇦 Page 2 — Saudization Compliance: Company-wide Saudization % vs regulatory target gauge; department-level compliance matrix with RAG status; trend line showing Saudization % over the last 12 months; at-risk departments highlighted in red
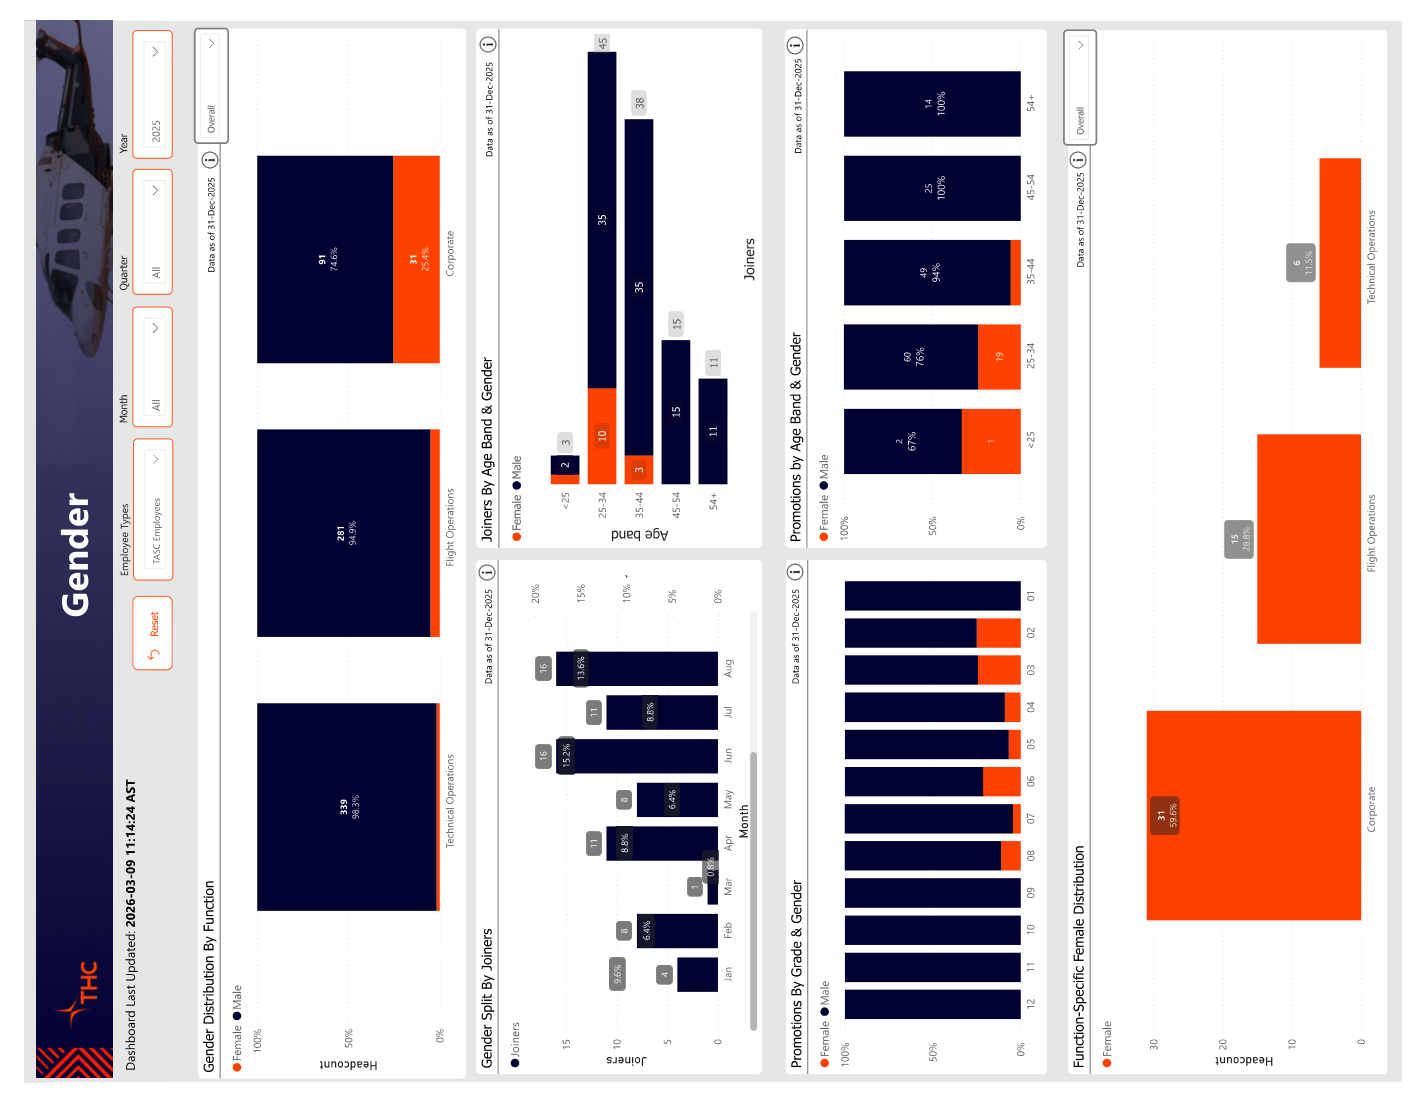
- ⚖️ Page 3 — Diversity & Inclusion: Gender split donut charts overall and by department; gender balance trend over time; grade-level gender breakdown matrix; nationality diversity breakdown (Saudi vs other GCC vs expat)
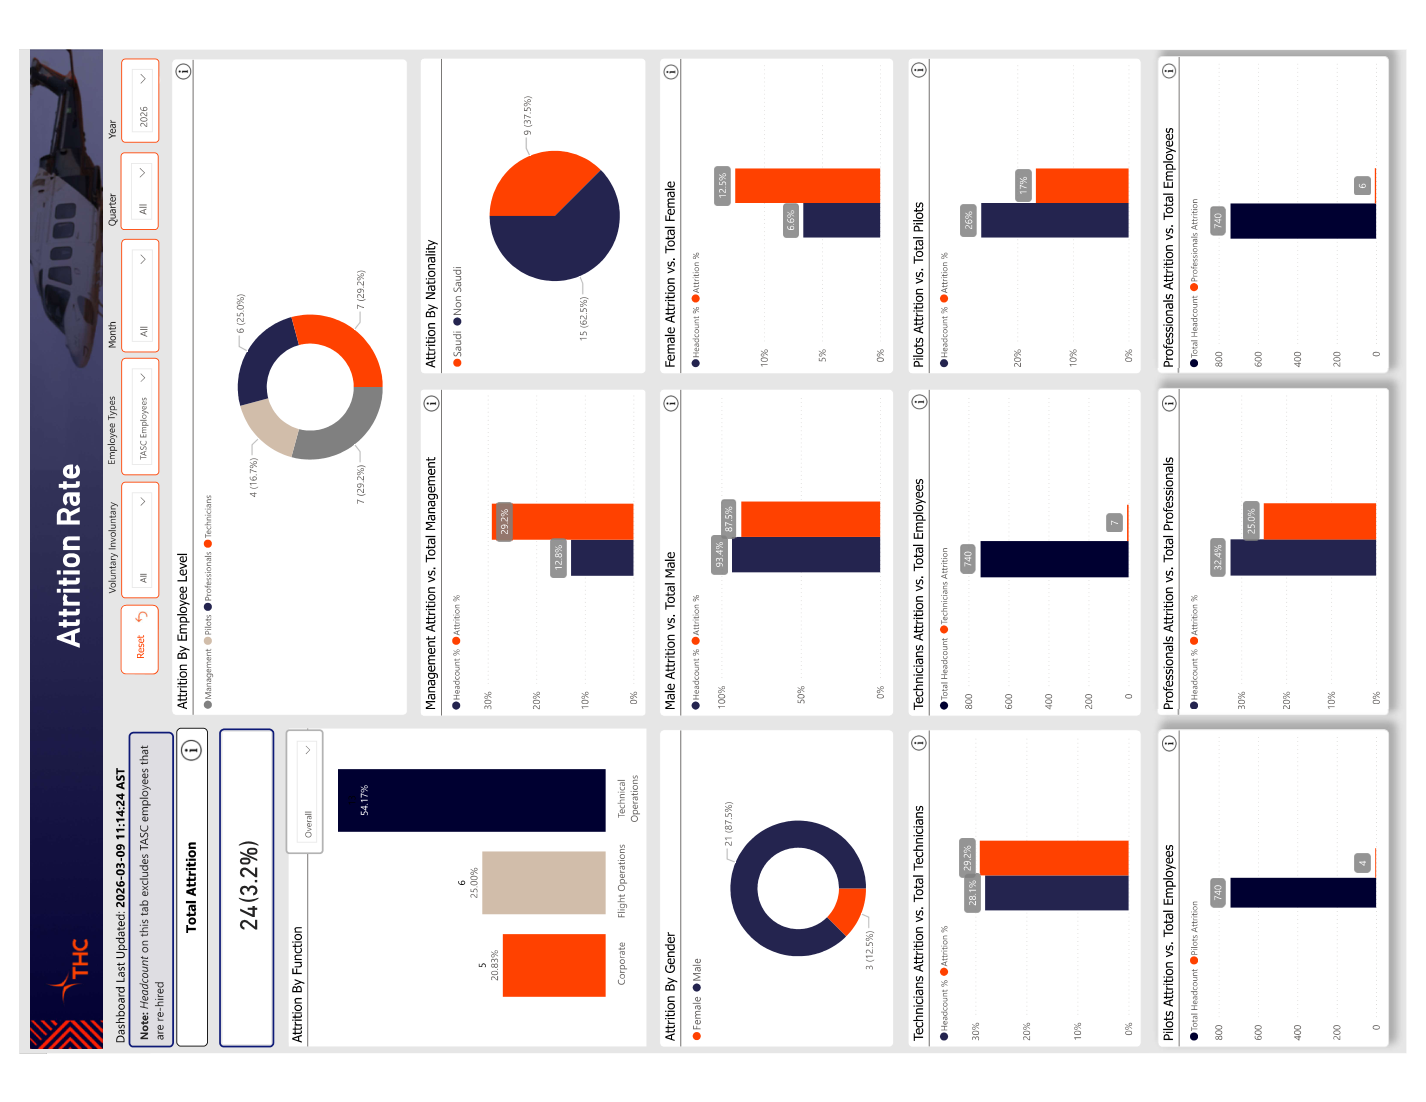
- 📉 Page 4 — Attrition Analysis: Rolling 12-month attrition rate KPI; voluntary vs involuntary split; attrition by department, by tenure band, and by job grade; top departure reasons from exit interview data; flight risk indicator based on tenure and grade combination
- 💰 Page 5 — Workforce Cost: Total salary cost by department; average salary by grade; cost-per-head trend; salary band distribution histogram; overtime hours and cost tracking
- 🔒 Row-Level Security: Department heads see only their own department's data; HR leadership sees all; implemented via RLS roles mapped to the Department dimension
DAX Highlights
- → Active Headcount = COUNTROWS(FILTER(Employees, Employees[HireDate] <= MAX(Calendar[Date]) && (ISBLANK(Employees[TermDate]) || Employees[TermDate] > MAX(Calendar[Date]))))
- → Saudization % = DIVIDE(CALCULATE([Active Headcount], Employees[Nationality] = "Saudi"), [Active Headcount])
- → Attrition Rate (Rolling 12M) = DIVIDE([Terminations L12M], ([Opening HC] + [Closing HC]) / 2) using DATESINPERIOD window
- → Tenure Band = calculated column using DATEDIFF(HireDate, TODAY(), MONTH) bucketed into bands with SWITCH(TRUE(), ...)
- → Net Headcount Change = [New Hires MTD] - [Terminations MTD] — displayed in KPI card with positive/negative arrow formatting