Overview
THC (a Saudi Arabian aviation services company) needed a single integrated financial reporting platform to replace a patchwork of Excel-based finance reports that were taking the FP&A team several days each month to compile. Finance leadership needed to track actual performance against budget across three core areas: the P&L, the balance sheet, and procurement spending.
The result is a 4-page Power BI dashboard where each page addresses a distinct financial audience — the executive summary for the C-suite, the P&L detail for finance managers, the balance sheet for treasury, and the procurement analysis for operations and supply chain. All figures are presented in Saudi Riyal (SAR) with thousands and millions abbreviation formatting.
Data Sources & ETL
- 📥 Source systems: ERP financial exports (GL actuals), separately maintained Excel budget files, and a procurement module export for PO and invoice data
- 🔄 Budget vs Actual consolidation: Actuals and budget loaded as separate fact tables; a shared Chart of Accounts dimension table used to align account codes across both sources
- 💱 Currency handling: All values in SAR; custom DAX formatting measures applied to display values in millions (SAR Mn) with one decimal place for executive pages and full values on detail pages
- 📅 Fiscal calendar: THC operates on a Hijri-aligned fiscal calendar; a custom date table was built mapping Gregorian months to the correct fiscal periods and quarter labels
- 🔗 Account hierarchy: Multi-level chart of accounts loaded as a parent-child hierarchy and flattened using PATH() and PATHITEM() DAX functions for drill-down navigation
- ✅ Validation: Opening and closing balance sheet totals reconciled to source ERP reports; variance tolerance set at <0.1% for sign-off
Key Visuals & Features
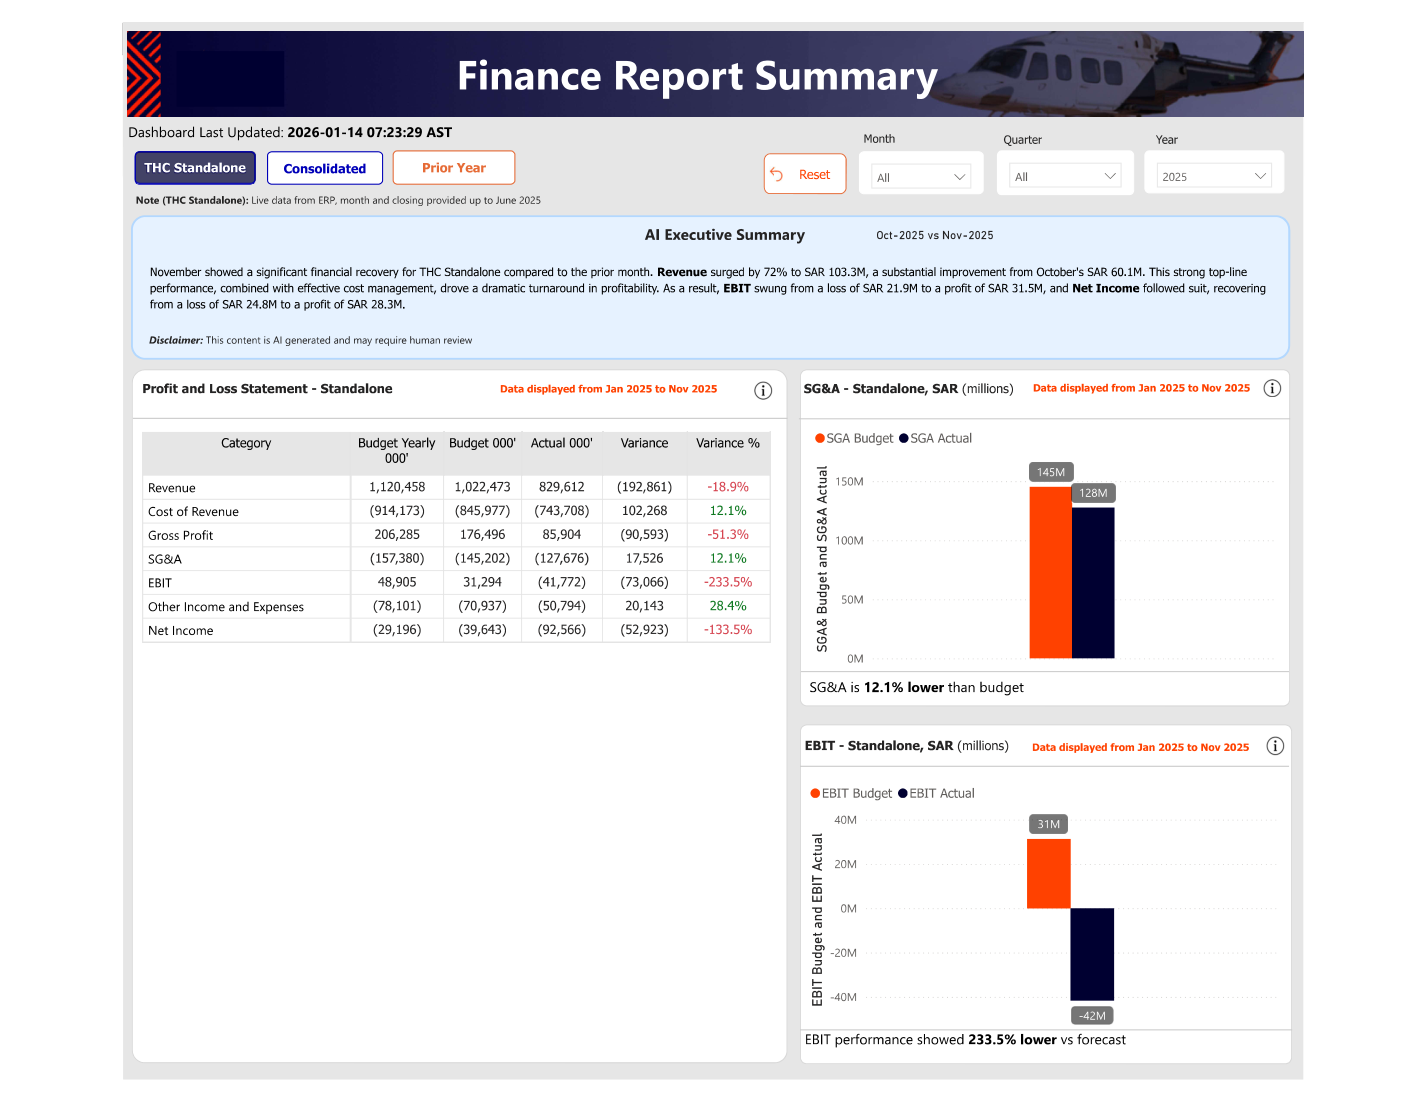
- 📋 Page 1 — Executive Summary: Revenue, EBITDA, Net Profit, and Budget Variance as large KPI cards with RAG status indicators; sparkline trend for each metric; single-glance financial health scorecard
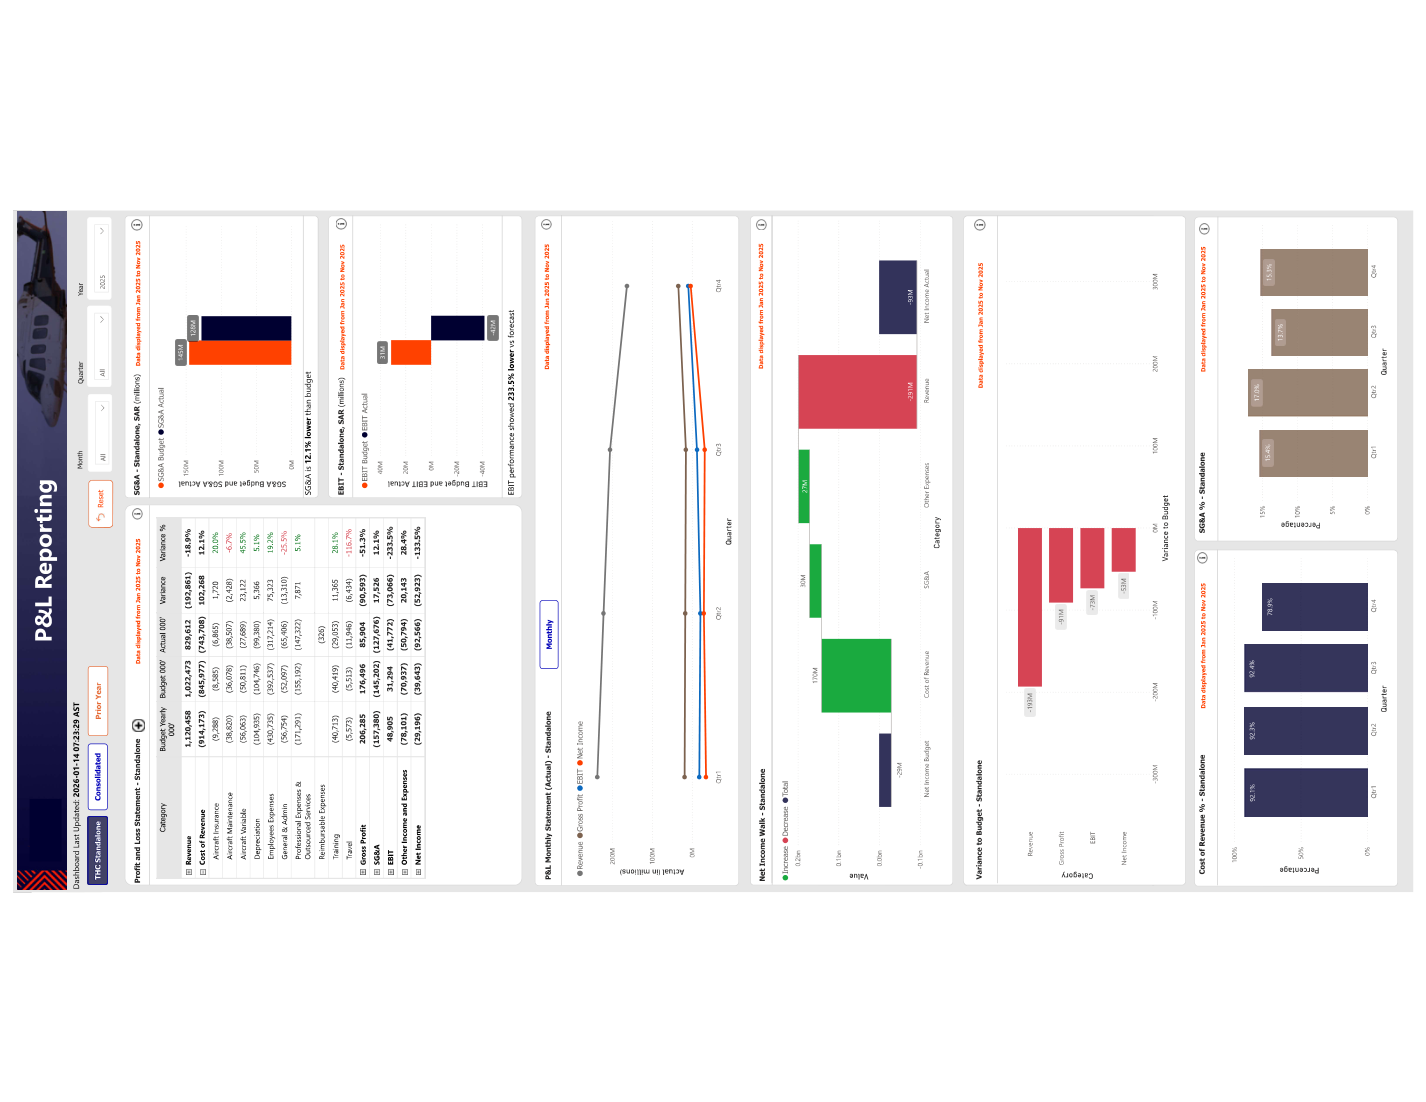
- 📉 Page 2 — P&L Analysis: Waterfall chart showing revenue → gross profit → EBITDA → net profit flow; clustered bar comparing actual vs budget by month; variance % column with conditional formatting; line chart showing cumulative YTD actuals vs YTD budget
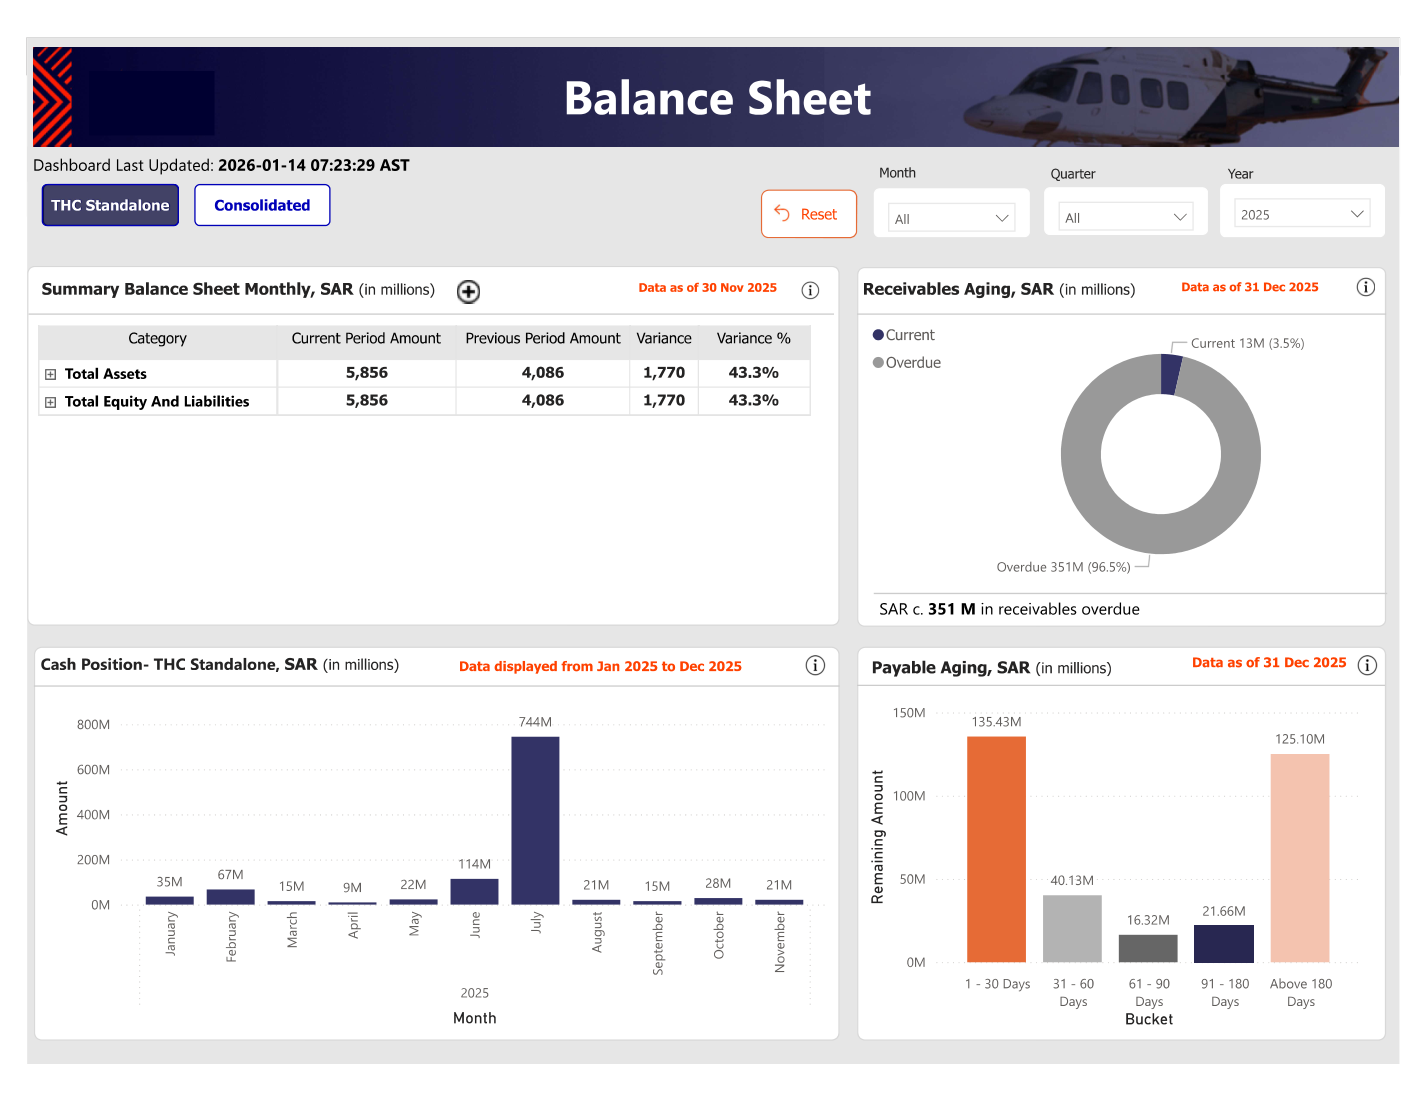
- 🏦 Page 3 — Balance Sheet: Asset and liability breakdown in a matrix with period-over-period change columns; current ratio and debt-to-equity KPI cards; liquidity trend line chart
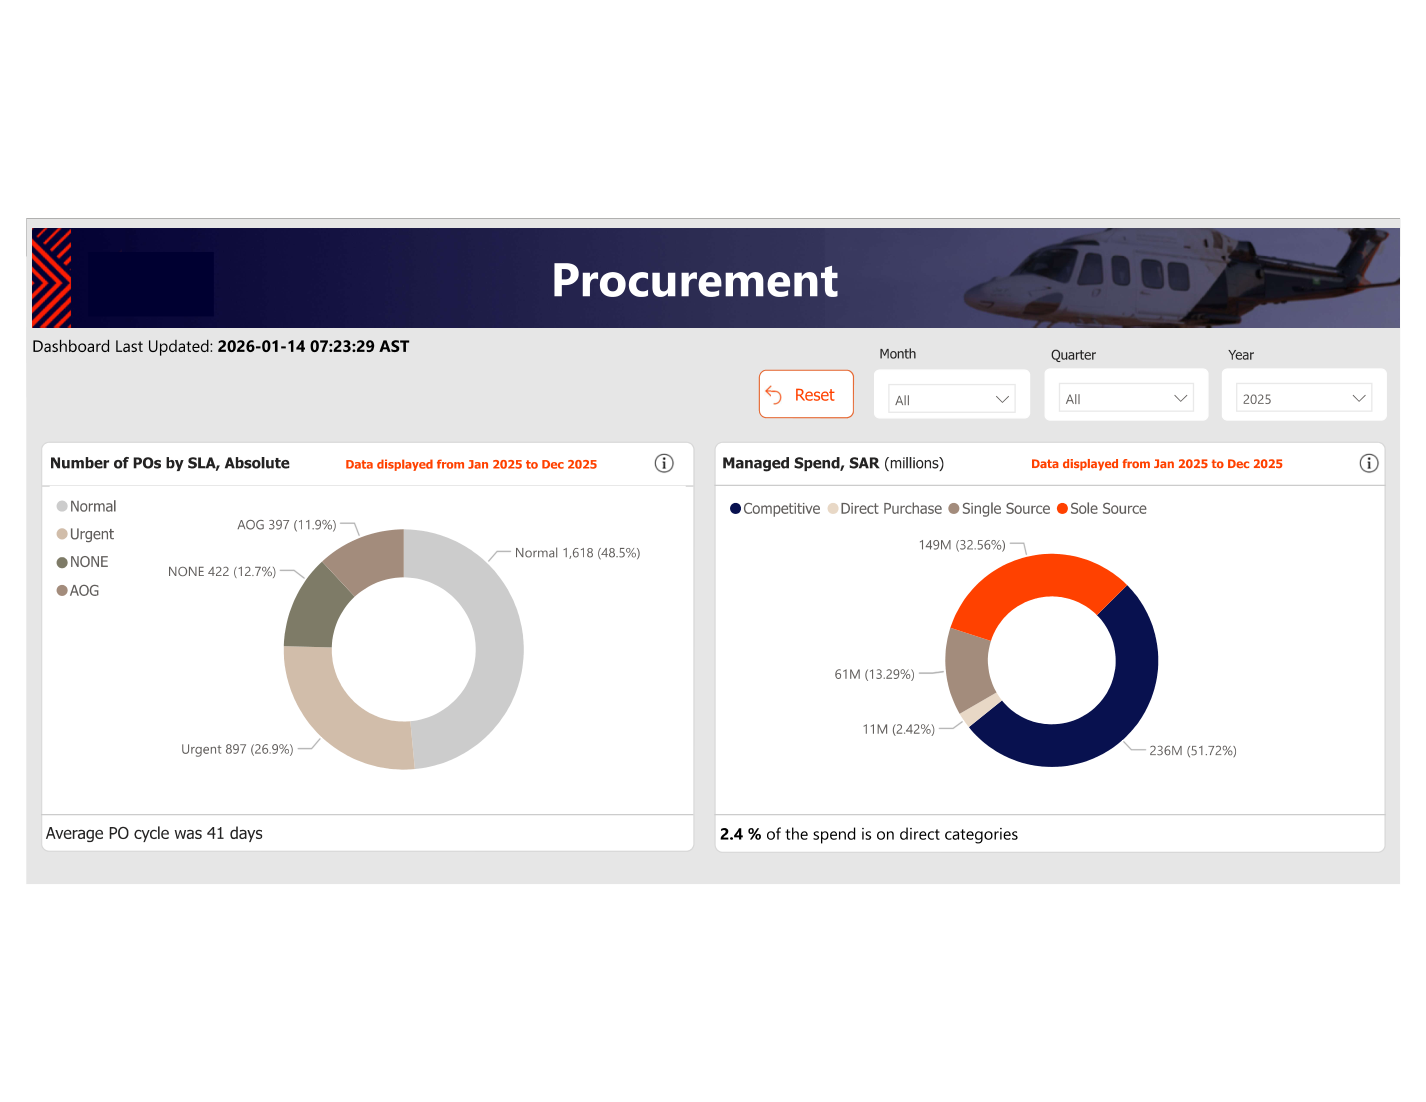
- 🛒 Page 4 — Procurement: Total PO value vs invoiced amount; top supplier spend ranking; spend by category donut chart; open POs vs closed POs status matrix; invoice aging table
- 🎯 Budget variance indicators: Every metric card shows the SAR and % variance vs budget with automatic green/red colouring — no manual formatting needed by the finance team
DAX Highlights
- → Budget Variance SAR = [Actuals] - [Budget] — with sign convention: positive = favourable for revenue lines, negative = favourable for cost lines
- → Budget Variance % = DIVIDE([Budget Variance SAR], ABS([Budget])) with IFERROR guard
- → YTD Actuals = CALCULATE([Actuals], DATESYTD(Calendar[Date], "12/31")) using fiscal year end parameter
- → Prior Period Actuals = CALCULATE([Actuals], DATEADD(Calendar[Date], -1, MONTH)) for MoM comparison arrows
- → Account Level Filter = PATH() + PATHITEM() flattening for parent-child hierarchy drill-down across the chart of accounts
Results & Impact
4Finance pages replacing multiple Excel reports
Real-timeBudget vs actual tracking on every metric
Days → HoursMonthly finance reporting time reduction