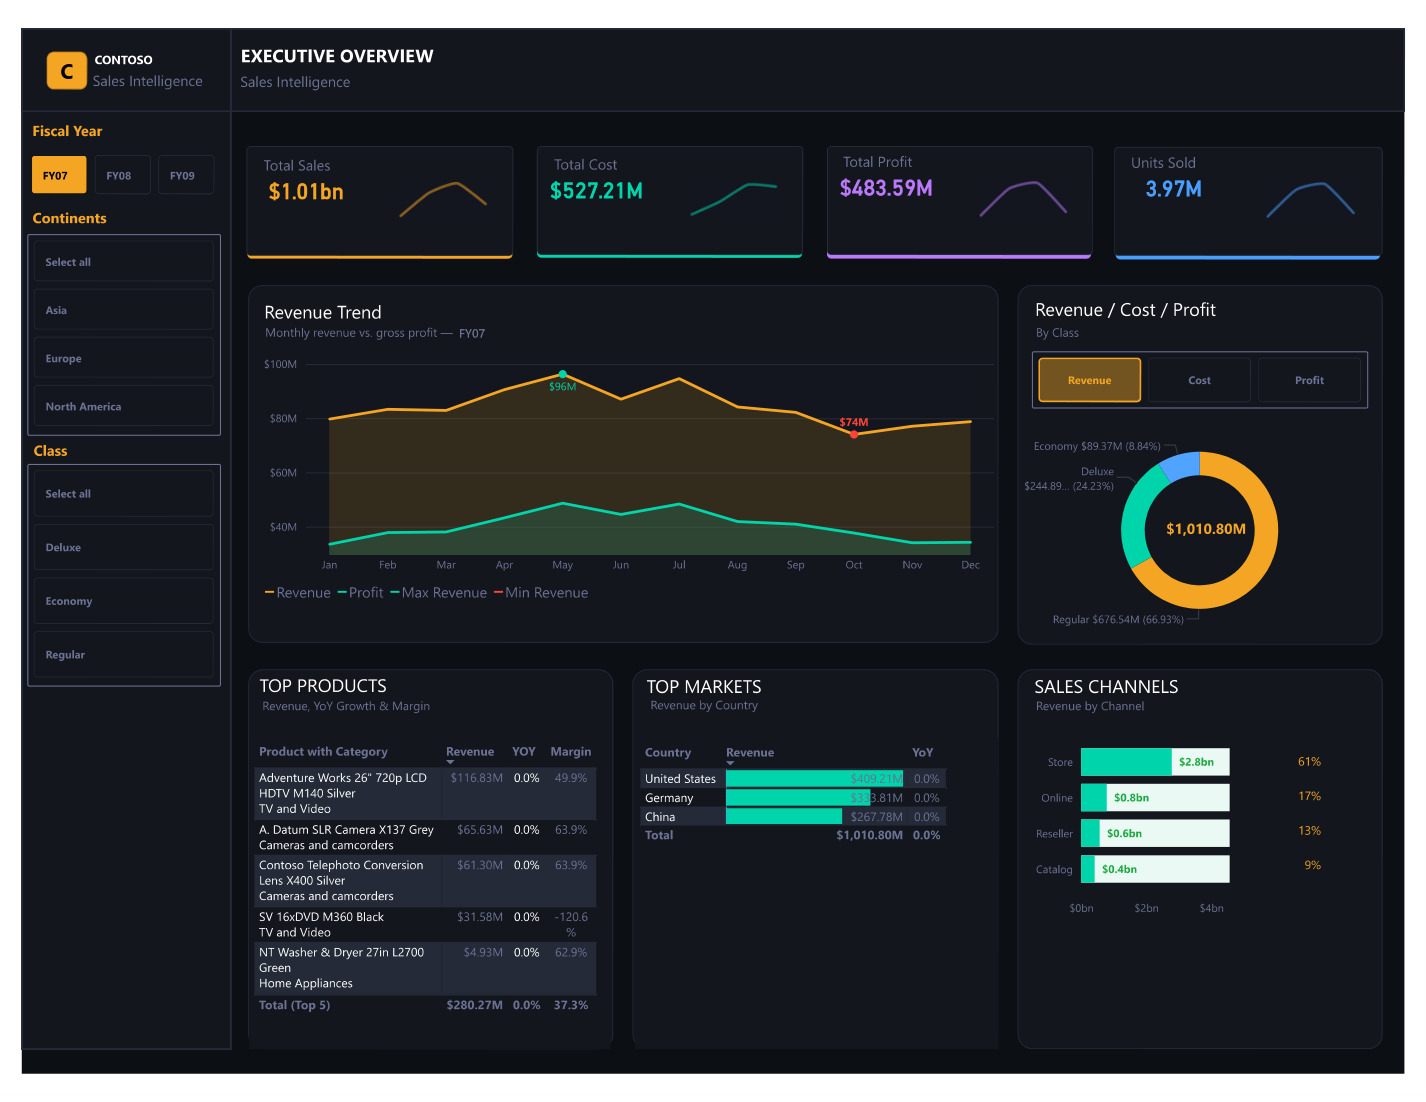
Overview
This dashboard was designed as a flagship portfolio piece demonstrating enterprise-level Power BI development using the well-known Microsoft Contoso retail dataset. The dataset simulates a global electronics and appliances retailer with operations across Asia, Europe, and North America spanning three complete fiscal years (FY97, FY98, FY99).
The design goal was a single, information-dense executive page that answers every critical sales question in one scroll — total performance, YoY trends, regional breakdown, product category mix, and top-performing stores — all in a dark-theme layout that communicates premium quality to stakeholders.
Data Sources & ETL
- 📥 Source: Microsoft Contoso SQL Server sample database — FactSales, DimProduct, DimStore, DimGeography, DimDate tables
- 🔄 Power Query: Connected directly to Contoso SQL Server; joined product, store, and geography dimensions; filtered to the FY97–FY99 reporting window; removed internal test records
- 📅 Date table: Marked the existing DimDate table as the official date table and extended it with fiscal year columns (Contoso uses a non-calendar fiscal year offset)
- 🗺️ Geography hierarchy: Built Continent → Region → Country → Store hierarchy for drill-down navigation in the map and matrix visuals
- 🏷️ Product hierarchy: Category → Subcategory → Product Brand hierarchy for category tree filtering and revenue contribution analysis
- ✅ Model relationships: Star schema with FactSales at the centre connected via surrogate keys to all dimension tables; inactive date relationships for order vs. delivery date switching
Key Visuals & Features
- 💰 KPI header row: Total Sales ($1.01bn), Total Units Sold, Gross Margin %, and YoY Growth % in large-format card visuals with trend sparklines
- 📈 Revenue trend: Area chart showing monthly sales across all three fiscal years with reference lines at YoY average — FY98 and FY99 layered for direct comparison
- 🌍 Regional breakdown: Filled world map with bubble sizing by revenue; accompanying matrix showing Continent → Country → Sales with percentage contribution and YoY delta columns
- 🏬 Store performance: Horizontal bar chart ranking top 20 stores by revenue with average line reference; store type segmentation (Online vs Reseller vs Physical)
- 📦 Category mix: Treemap showing revenue share by product category; donut showing Electronics vs. Appliances vs. Other split
- 🎨 Dark executive theme: Custom JSON theme with near-black backgrounds, high-contrast white typography, and accent colours that pop against dark surfaces
DAX Highlights
- → YoY Sales Growth % = DIVIDE([Sales] - CALCULATE([Sales], SAMEPERIODLASTYEAR(DimDate[Date])), CALCULATE([Sales], SAMEPERIODLASTYEAR(DimDate[Date])))
- → Cumulative YTD Sales = TOTALYTD([Sales], DimDate[Date]) — used in area chart with fiscal year boundary parameter
- → Continent % Share = DIVIDE([Sales], CALCULATE([Sales], ALL(DimGeography[Continent]))) for proportional map colouring
- → Gross Margin % = DIVIDE([Revenue] - [Cost of Goods], [Revenue]) with dynamic threshold formatting (green above 35%, amber 25–35%, red below)
- → Running Total = CALCULATE([Sales], FILTER(ALL(DimDate), DimDate[Date] <= MAX(DimDate[Date]))) for cumulative revenue waterfall
Results & Impact
$1.01bnTotal sales surfaced in a single executive view
3 FYsFull fiscal year time intelligence (FY97–FY99)
3 ContinentsAsia · Europe · North America geographic coverage