Overview
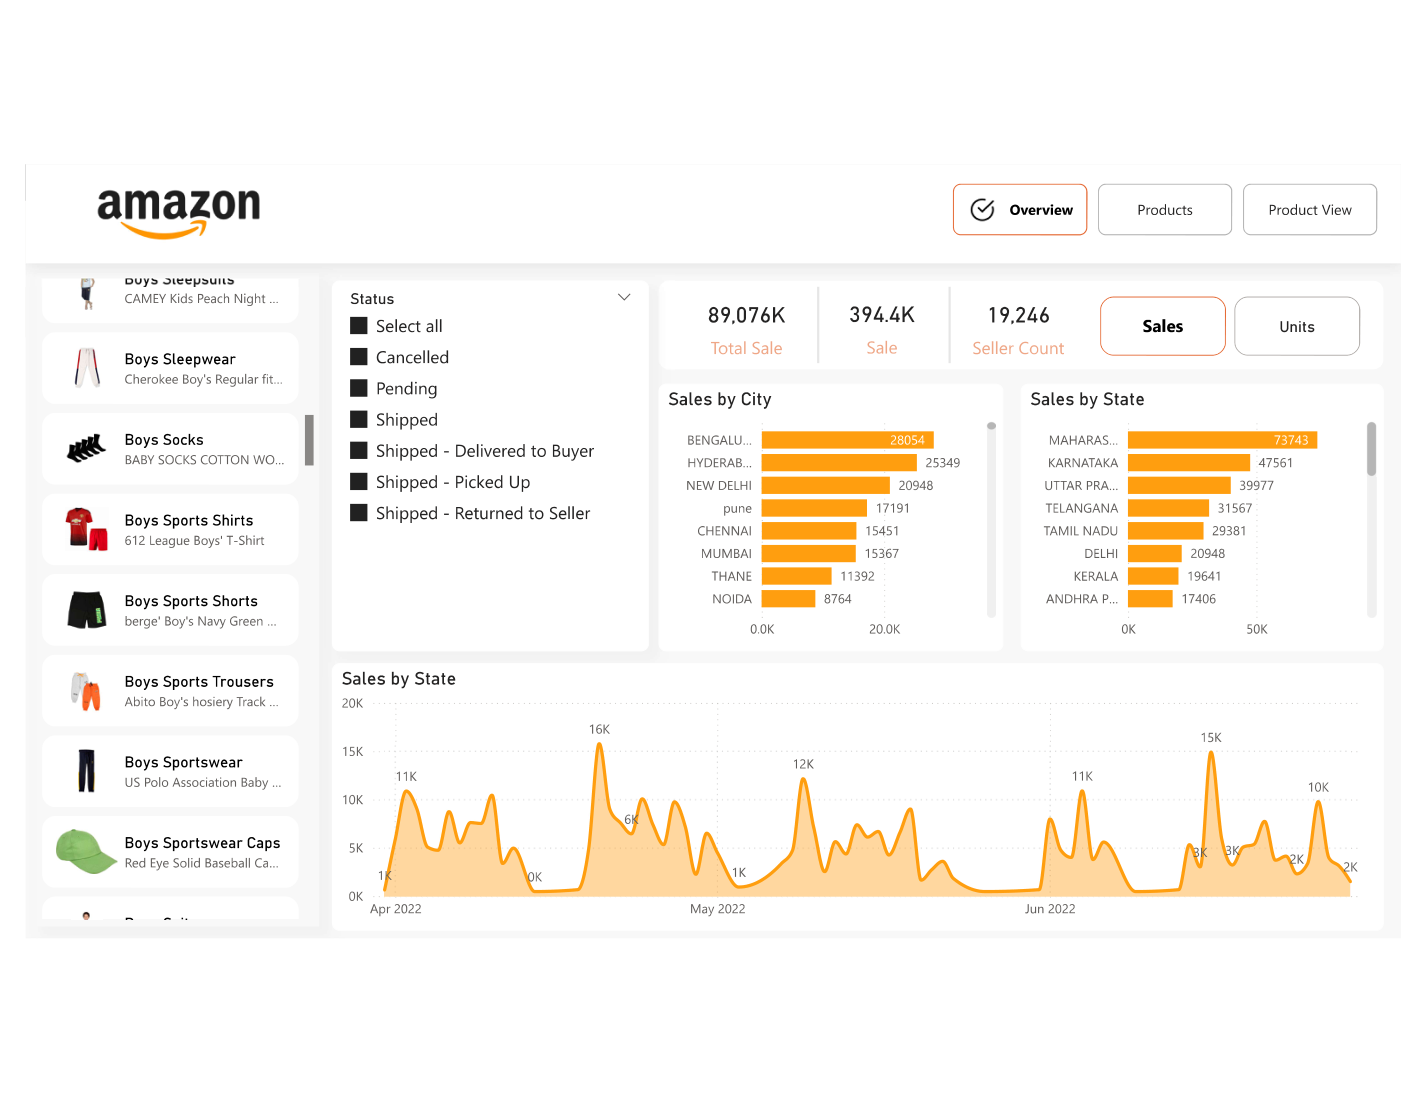
This dashboard was built to give e-commerce managers and marketplace sellers a clear, filterable view of Amazon India fashion sales performance across April, May, and June 2022. The raw data contained thousands of order-level records with no pre-aggregation — everything from SKU-level sales and shipment status to city and pin-code level delivery data.
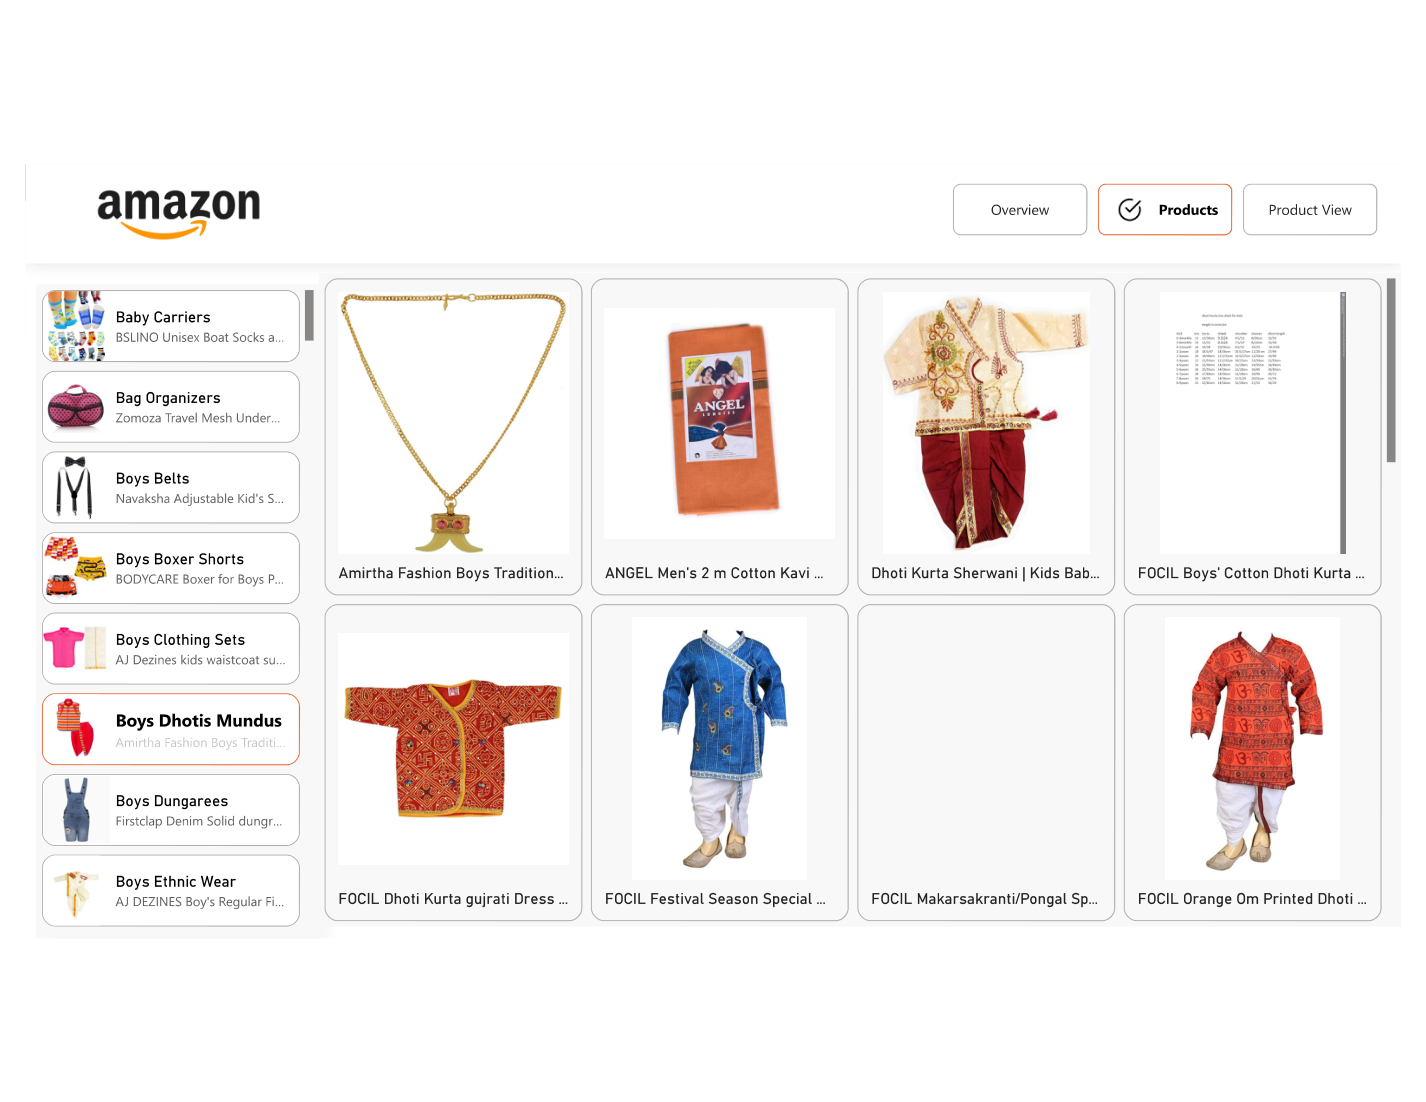
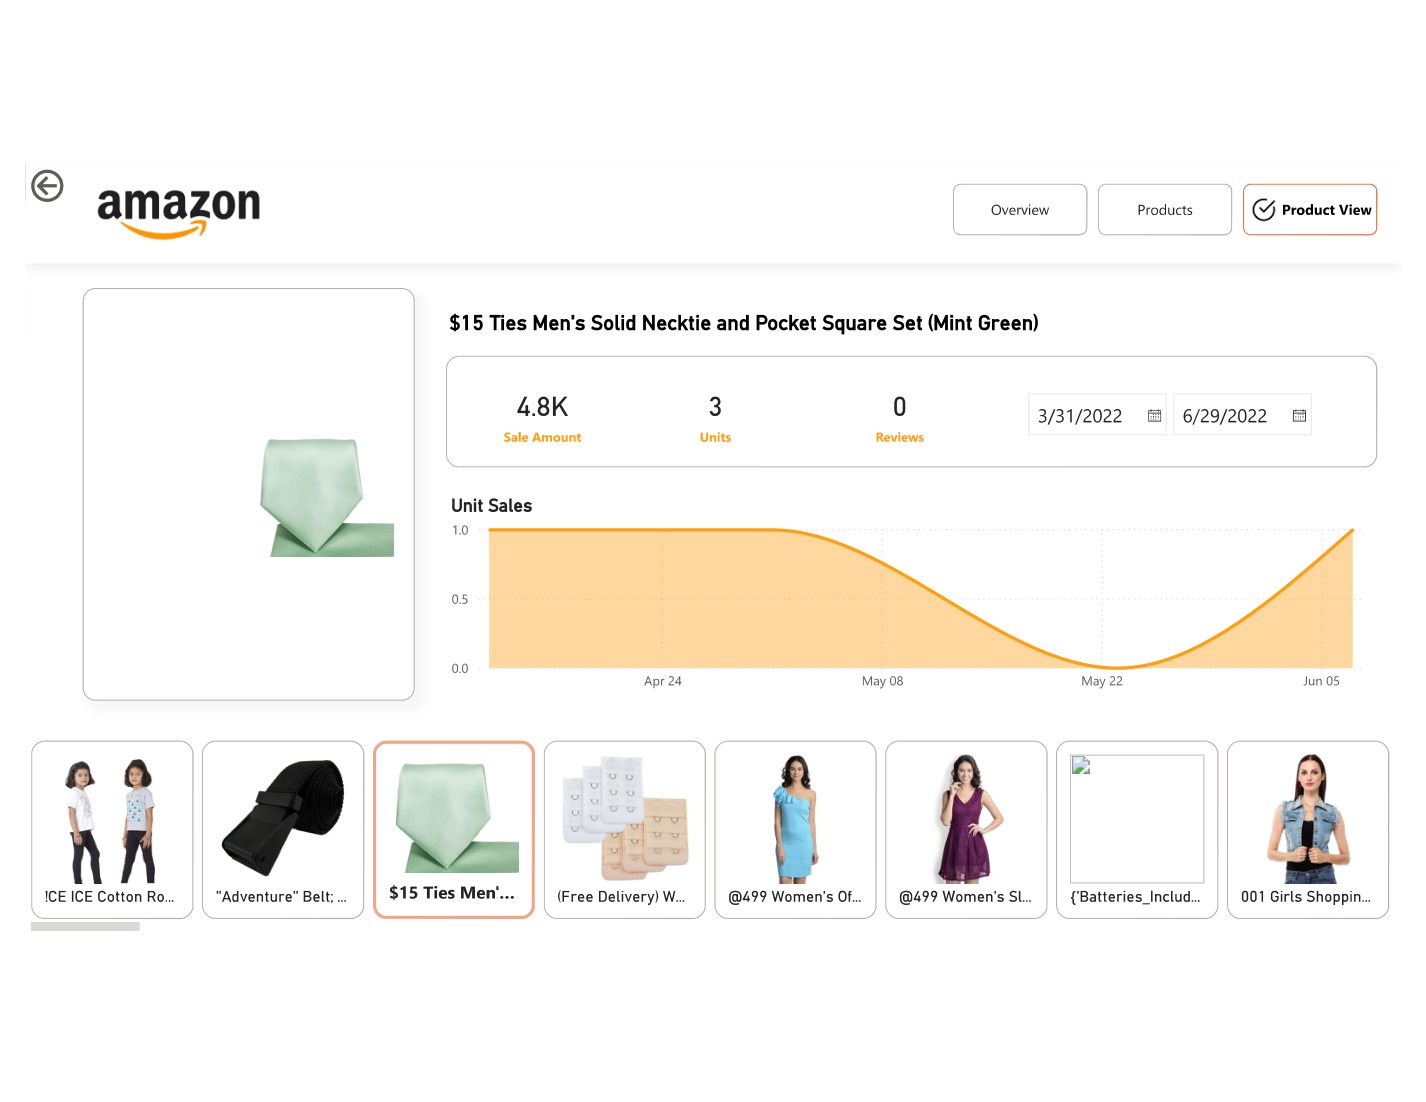
The finished report runs across three pages: a high-level Sales Overview, a Product Gallery page showcasing category-level performance, and a Product Detail drill-through page that surfaces SKU-specific metrics on demand. Every page is connected by consistent slicers and cross-filtering so users can explore the data from any angle.
Data Sources & ETL
- 📥 Source: Amazon seller export CSV — order-level records with fields including Order ID, SKU, Category, Sale Amount, Ship City, Ship State, Fulfilment Channel, and Order Status
- 🔄 Power Query transformations: Promoted headers, trimmed whitespace, standardised Category and Status text casing, replaced null Sale Amount values with zero, removed cancelled test orders
- 📅 Date table: Generated a complete calendar table in DAX covering the full Apr–Jun 2022 period with week number, month name, and quarter columns for time-intelligence measures
- 🗺️ Geography enrichment: State names normalised to match Power BI's built-in India map layer for accurate filled-map rendering
- ✅ Status segmentation: Order Status grouped into logical fulfilment bands — Delivered, Shipped, Pending, Cancelled, Returned — for clean slicer navigation
Key Visuals & Features
- 📊 Page 1 — Sales Overview: Total orders, total revenue, average order value, and fulfilment rate KPI cards at the top; bar charts for revenue by category and by month; filled map of India showing order density by state; order status donut chart
- 🛍️ Page 2 — Product Gallery: Visual matrix of product categories with thumbnail-style cards showing units sold, revenue, and return rate; sortable and filterable by category and date range
- 🔍 Page 3 — Product Detail: Drill-through from any product card to a dedicated SKU-level page showing order timeline, city breakdown, fulfilment channel split, and status history
- 🔁 Cross-filter interactivity: All visuals are cross-filter enabled — clicking a state on the map filters the category bar and the status donut simultaneously
- 📌 Slicers: Ship State, Category, Fulfilment Channel, and Date Range slicers on every page with sync across pages
DAX Highlights
- → Fulfilment Rate % = DIVIDE([Delivered Orders], [Total Orders]) — used in KPI card with conditional formatting (red/amber/green threshold)
- → MoM Revenue Change % = DIVIDE([Revenue] - [Revenue PM], [Revenue PM]) using DATEADD for prior-month comparison
- → Cancelled Order Value = revenue foregone from cancelled orders — used in an insight callout box to surface lost revenue at a glance
- → Top N Category filter = RANKX pattern to let users dynamically filter to Top 5 or Top 10 categories
Results & Impact
3Interactive report pages with full cross-filtering
Q2 2022Complete Amazon India fashion sales coverage
City-levelGeographic granularity on filled map